Two Failures a Year: What the FDIC Data Actually Says About the Banking System in 2026
On May 1, 2026, the Federal Deposit Insurance Corporation closed Community Bank and Trust – West Georgia, a three-branch lender in LaGrange, Georgia, with $288 million in assets. It was the second U.S. bank failure of the year. The first, Metropolitan Capital Bank & Trust of Chicago, was closed on January 30, 2026, with $261 million in assets. Through the first five months of the year, the entire FDIC failure count is two banks with combined assets of approximately half a billion dollars — a rounding error in a banking system that holds roughly $24 trillion in total assets.
The conventional reading of these numbers, repeated across financial press coverage, is that the U.S. banking system has stabilized. The 2023 shock that took down Silicon Valley Bank, Signature Bank, and First Republic Bank — three of the largest bank failures in American history — was followed by two failures in 2024, two in 2025, and two through the first five months of 2026. The Deposit Insurance Fund balance has grown to $153.9 billion. The reserve ratio is climbing back toward its statutory minimum. FDIC Chair Travis Hill has reorganized resolution procedures around faster sales and shorter receivership timelines. The official narrative is that the system absorbed the 2023 stress, regulators responded effectively, and the banking sector has returned to ordinary operating conditions.
This essay argues that the official narrative is reading the wrong variable. Two bank failures per year is not what a healthy banking system looks like in the post-2008 environment. It is what a banking system looks like when the substitute layer described elsewhere in this series is preventing the failures that would otherwise occur. The full FDIC dataset, read carefully against every other indicator of systemic stress in the same period, tells a story that the failure count alone cannot reveal — and the story is one the framework has been describing across the rest of this series, now visible in the empirical record with unusual clarity.
This is the first installment of a new open-ended series — Watching the Cracks — that tracks the early warning signs of system stress as they emerge in the data. Where the prior series in this catalog have been thematic and closed (the foundational six, the housing trilogy, the cryptocurrency trilogy), this one is structurally different: it is updated as conditions warrant, anchored in specific empirical signals, designed to be read as ongoing diagnostics rather than as completed analyses. The first installment establishes the baseline. Subsequent installments will track how the diagnostic readings evolve.
The chronology
The FDIC publishes a complete record of every U.S. bank failure since October 1, 2000. The dataset contains 574 failures across 26 calendar years. The full chronology is shown below.
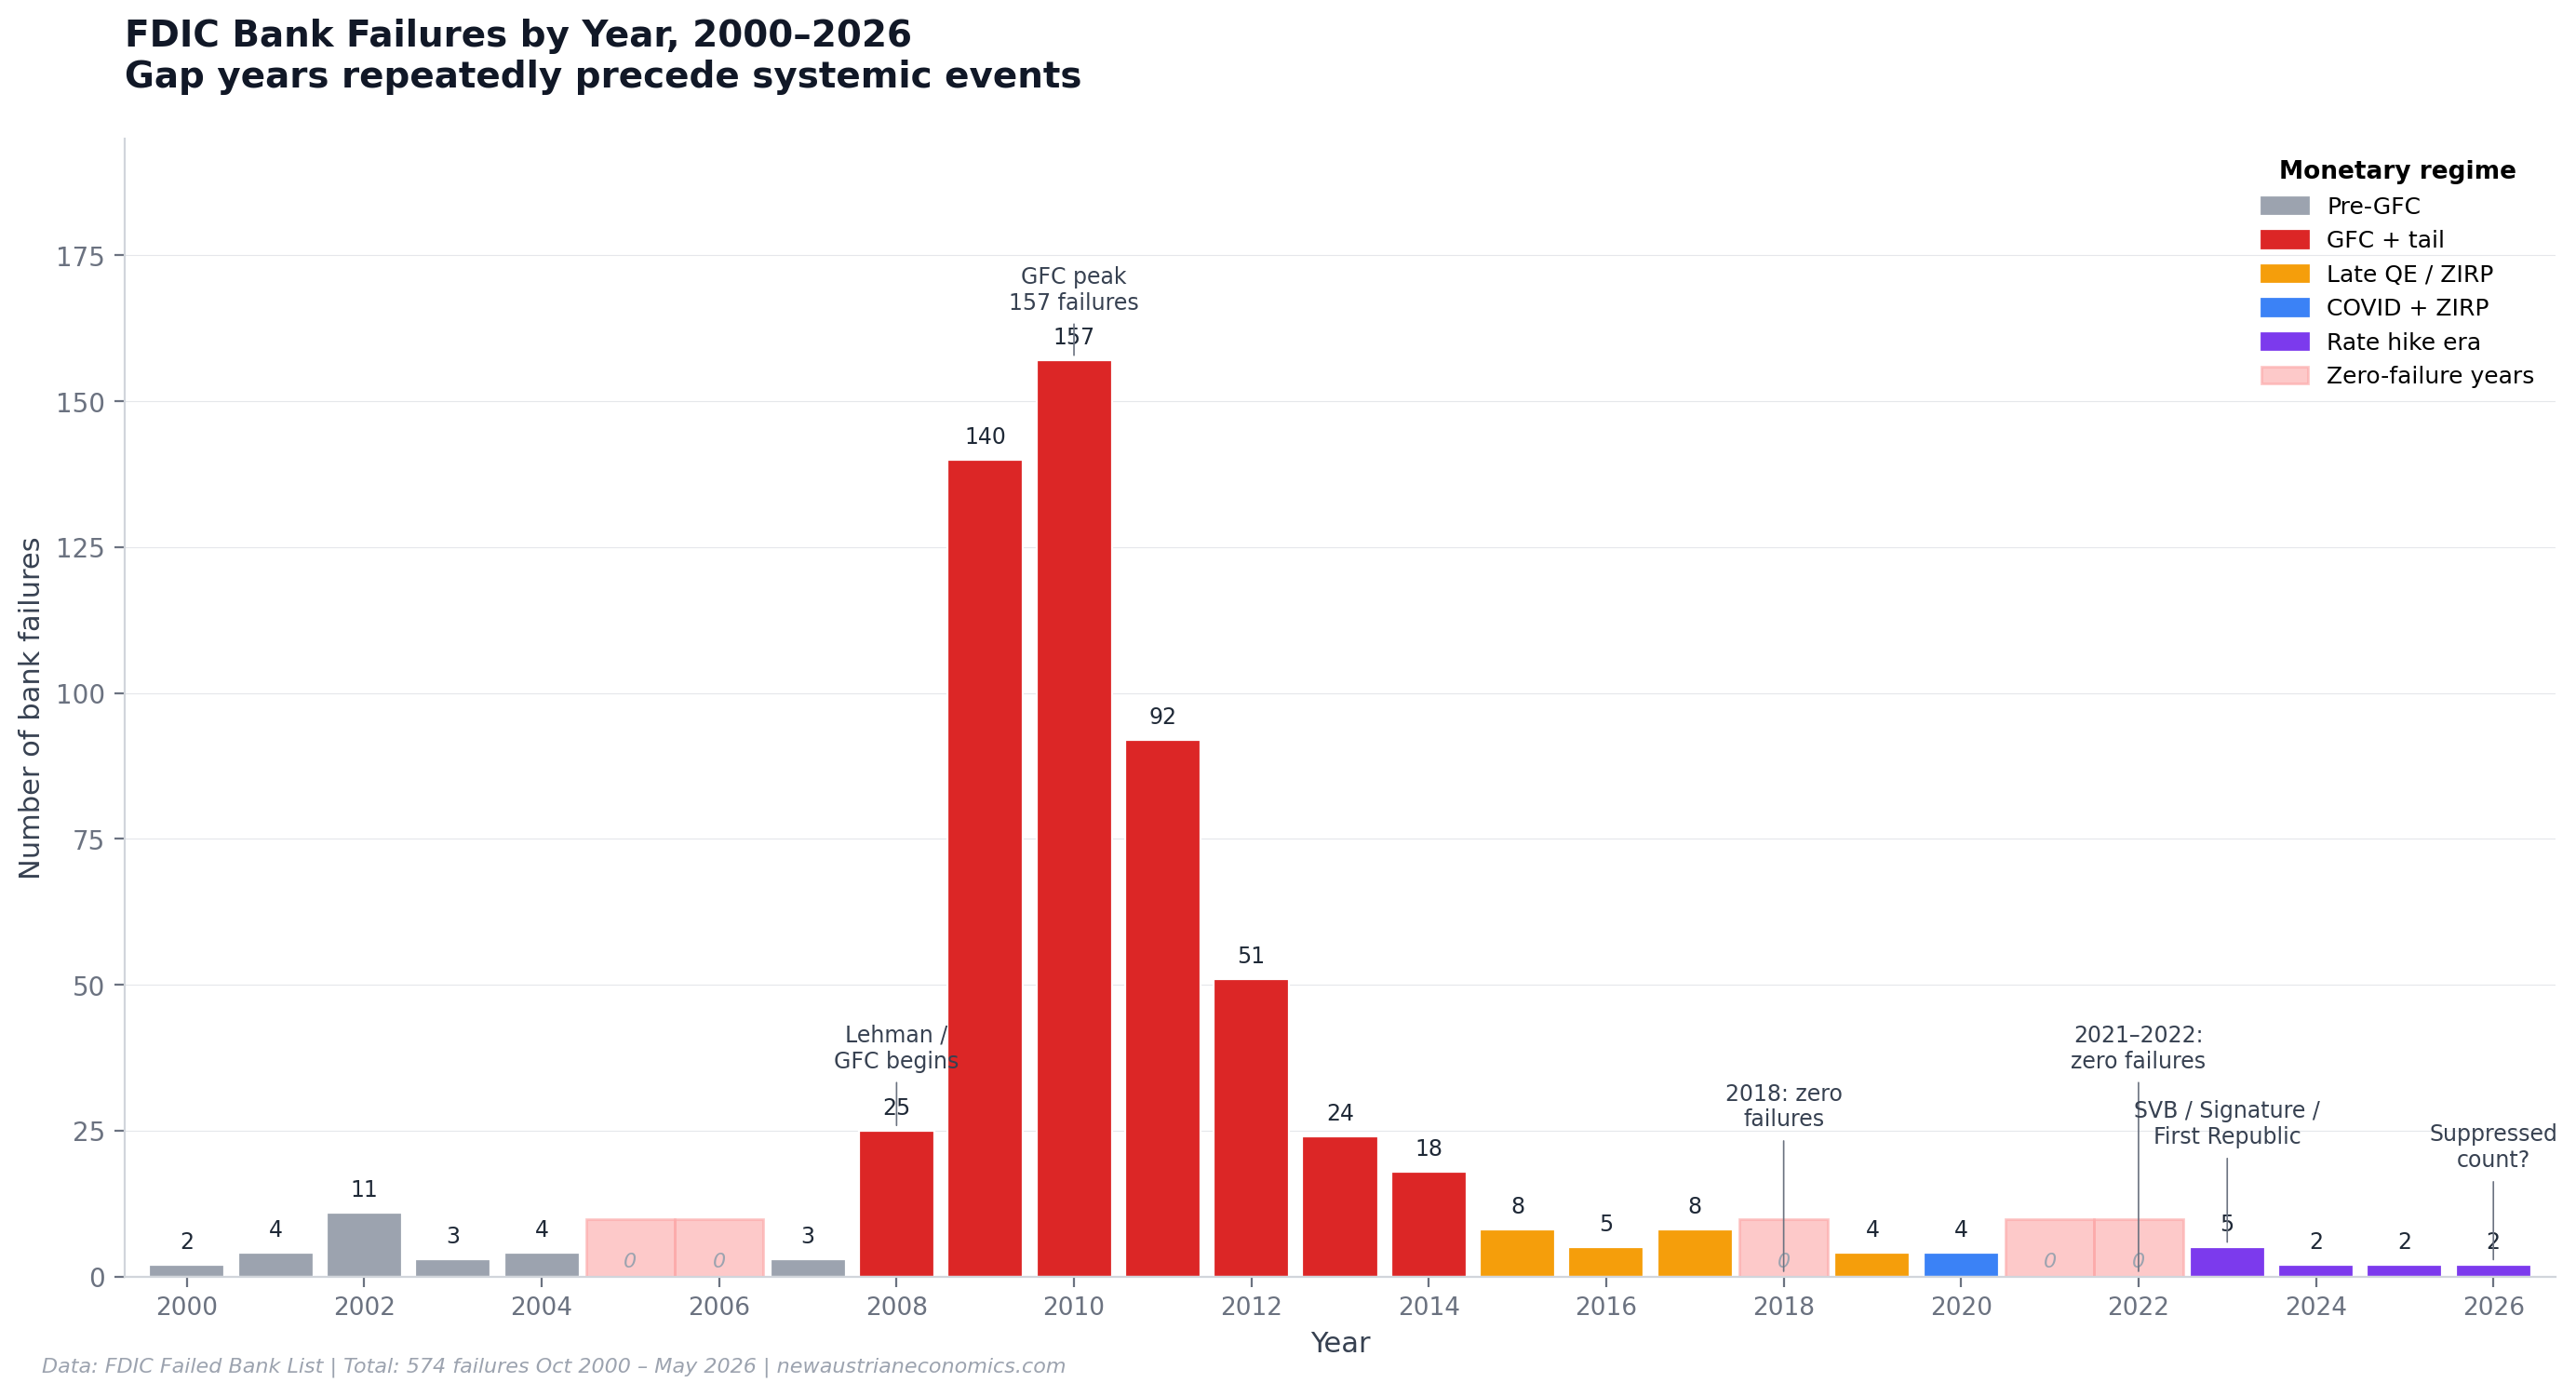
The pattern divides cleanly into five monetary regimes.
The pre-GFC period (2000–2007) produced 27 failures across eight years, an average of 3.4 per year, with two zero-failure years (2005 and 2006). The banking system was in expansion mode, credit was abundant, and the housing market was producing the apparent solvency that would later be revealed as illusory.
The Global Financial Crisis and its tail (2008–2014) produced 507 failures across seven years, an average of 72 per year, with the peak in 2010 (157 failures). This was the cleanup of two decades of accumulated structural fragility, conducted in real time, with the FDIC and Federal Reserve acting as crisis managers rather than ordinary supervisors.
The late QE / ZIRP period (2015–2019) produced 25 failures across five years, an average of 5 per year, with zero failures in 2018. This was the longest period of monetary accommodation in modern U.S. history, with the federal funds rate held near zero for most of the decade and the Federal Reserve's balance sheet expanded to absorb the substitute-layer pressures the GFC had revealed.
The COVID-and-ZIRP period (2020–2022) produced 4 failures across three years, with two consecutive zero-failure years (2021 and 2022). The pandemic response — federal stimulus, expanded Fed balance sheet, emergency lending facilities, regulatory forbearance — produced apparent stability across the banking sector that masked the substantial duration risk being accumulated as banks loaded up on long-dated Treasury and agency MBS securities at the historically low yields of 2020 and 2021.
The rate-hike era (2023–2026) has produced 11 failures across roughly three and a half years. Five occurred in 2023 (Silicon Valley Bank, Signature Bank, and First Republic Bank in March–May, plus two smaller community banks later in the year), two in 2024 (First National Bank of Lindsay in Oklahoma and Republic First Bank in Philadelphia, the latter the largest of the post-2023 failures), two in 2025 (Pulaski Savings Bank in Chicago and Santa Anna National Bank in Texas), and two so far in 2026.
The most consequential observation in the entire chronology is what happens between these regimes — specifically, what happens in the years immediately preceding a shock. The five zero-failure years in the dataset (2005, 2006, 2018, 2021, 2022) divide into two clusters, each of which sits immediately before a systemic event. The 2005–2006 zero-failure pair preceded the GFC. The 2018 zero-failure year preceded the 2019 repo market dysfunction (which the Federal Reserve resolved through emergency interventions that absorbed approximately $400 billion of stress in one quarter). The 2021–2022 zero-failure pair preceded the 2023 SVB / Signature / First Republic shock.
In every prior instance, when the failure count went to zero, it stayed near zero only as long as the substitute layer could absorb the pressure. The next clustered failure event came within 12–24 months. The pattern is not coincidental. The framework describes it in detail across the rest of this series: a zero-failure period is the empirical signature of a substitute layer at maximum extension, holding back failures that would otherwise occur in a system without the support apparatus.
The 2024–2026 reading of two failures per year is structurally similar to the 2005–2006 and 2021–2022 readings. The framework's prediction is not that another systemic event is imminent on a specific calendar — the framework cannot predict timing — but that the configuration producing the current low failure count is the same configuration that has, in two prior instances, preceded clustered failure events at a 1–2 year horizon. The current reading should be interpreted accordingly.
The divergence between the failure count and the underlying stress
If two failures per year were genuinely the signature of a healthy banking system, the underlying stress indicators would be calm. They are not. Every metric that the failure count is supposed to summarize is currently elevated.
Unrealized losses on bank-held securities portfolios stood at $306 billion as of Q4 2025, per the FDIC's own Quarterly Banking Profile. This was an improvement from $337 billion the prior quarter — but the improvement was not the result of bank actions. The FDIC explicitly attributed the decline to the fact that long-term mortgage rates fell during the quarter, increasing the market value of mortgage-backed securities held by banks. The FDIC further notes that "increases in longer-term interest rates since the end of the first quarter would likely reverse most of these improvements in unrealized losses if measured today." Translated: the unrealized losses are a function of where rates happen to be on the reporting date. Rates fell, the losses shrank, but the underlying duration mismatch is unchanged. This is the SVB pathology distributed across the system, masked by held-to-maturity accounting rather than resolved.
Sixty banks were on the FDIC Problem Bank List as of Q4 2025, up from 57 in Q3. The Problem Bank List captures institutions with the worst CAMELS supervisory ratings (4 or 5 on a 5-point scale). The list grew during a quarter in which only two banks closed. This divergence — accumulating problem banks without corresponding resolutions — is the regulatory signature of forbearance rather than recovery. Problem banks are being kept open through extended supervisory engagement rather than allowed to fail. The FDIC characterizes the 60-bank count as "well within the normal range of 1-2% during a non-crisis period." That characterization is technically correct on a percentage basis. It is also unhelpful because the trend is the diagnostic variable, not the level. The list grew by 3 banks in one quarter while only 2 closed. Over four such quarters, the list grows by 12 while resolutions clear 8 — a net accumulation of 4 problem banks per year that is not visible in the failure count.
Office commercial real estate CMBS delinquency reached 12.34% in January 2026, according to Trepp data — a record high in the modern series. This is the underlying market signal for what is happening to the commercial real estate exposure embedded across the banking system. Bank-held CRE loan delinquency at the same time was 1.58% — also at decade highs but eight times lower than the underlying market. The gap between the two numbers is the precise quantification of "extend and pretend": banks restructuring, modifying, and extending CRE loans rather than recognizing the actual deterioration in the underlying collateral. The Federal Reserve's October 2025 Senior Loan Officer Opinion Survey explicitly documents the practice. The FDIC's 2026 Risk Review names commercial real estate as a continuing supervisory focus area. Office values have fallen approximately 30% from their 2022 peak. None of this stress is visible in the bank failure count.
$875 billion in commercial real estate debt matures in 2026, with $100 billion in office CMBS specifically, more than half of which Trepp characterizes as "unlikely to pay off at maturity." The 2026 maturity wall is the largest single year of CRE refinancing pressure in the post-2008 period. The framework cannot predict which specific banks will be most exposed to losses on the failed refinancings, but the aggregate exposure is large enough that the failure count over the next 18 months will be a function primarily of how aggressively the FDIC and OCC engage in forbearance rather than of what the underlying credit quality dictates.
Loans to nondepository financial institutions (NDFIs) represented the single largest dollar increase in bank loan growth in Q4 2025. NDFI loans are loans to private credit funds, business development companies, asset-based lending vehicles, and similar shadow-banking entities. The category has grown substantially over the past five years as banks have effectively outsourced credit risk to lightly-regulated private intermediaries while maintaining funding exposure. The framework treats this as a substitute-layer phenomenon: the visible loan portfolio looks safe because the credit risk is being borne by entities that don't appear on bank balance sheets, but the funding exposure flows back to the banks through the NDFI loan relationships. This is structurally similar to the conduit-and-SIV arrangements that contributed to 2008. The supervisory reporting on NDFI exposures is currently being expanded, but the data quality is not yet sufficient to assess the embedded stress.
Each of these indicators, taken in isolation, is consistent with a banking system facing meaningful but contained pressure. Taken together, they describe a system in which substantial structural stress is accumulating across multiple dimensions while the headline failure count is held artificially low through some combination of accounting, forbearance, and substitute-layer support. The framework's reading is that this is exactly what 2005–2006 looked like in the contemporaneous data. It is also what 2021–2022 looked like. The post-event historical reconstruction of both prior periods has been clear. The contemporaneous diagnosis, in both cases, was substantially less clear, because the failure count was the variable most analysts were tracking.
What the recent failures reveal
The two failures of 2026 are individually small. They are also each individually informative about the structural pressures at work in the banking system. Reading them carefully reveals the same patterns the framework has been describing throughout this series.
Metropolitan Capital Bank & Trust (Chicago, closed January 30, 2026, $261 million in assets) was a Universal Bank focused on small- and medium-sized business clients across 46 states and 10 countries. The failure, per the Illinois Department of Financial and Professional Regulation, was driven by "unsafe and unsound conditions and an impaired capital position." The deeper detail, available in the FDIC examination data and confirmed by independent reporting, is that approximately 82% of Metropolitan Capital's portfolio was in commercial real estate and private equity exposures. This is not an ordinary banking concentration. It is, in framework terms, an extreme concentration in two of the lowest-saleability asset classes available to a community bank — illiquid CRE collateral and private equity stakes that cannot be marked to a clearing market. Metropolitan Capital reported $43 million in Federal Home Loan Bank advances against approximately $212 million in deposits in Q3 2025, indicating the bank had been reaching for wholesale funding to support its asset base for some period before failure. The failure represented 7.5% of total assets to the Deposit Insurance Fund, which is high relative to historical norms.
Community Bank and Trust – West Georgia (LaGrange, Georgia, closed May 1, 2026, $288 million in assets) failed under similar but distinct conditions. The single most important detail in the failure record is that the Federal Reserve issued an enforcement action against Community Bank and Trust's holding company in April 2026, approximately one month before the bank closure. The enforcement action ordered the holding company to bolster board oversight, improve senior management, and strengthen its capital position. The bank failed within 30 days. The pattern — enforcement action followed by failure within one to two months — is the most reliable leading indicator of bank failure available to anyone tracking the public regulatory data. The framework treats this as a tracking signal worth following systematically: every Federal Reserve enforcement action against a bank holding company should be logged and watched, because the action itself is the regulator's acknowledgment that supervisory engagement has failed and resolution is approaching. The FDIC failure rate among Fed-enforcement-action-recipient bank holding companies is, by the framework's reading of the historical record, substantially higher than the population baseline. The exact rate would require a more careful study, but the directional observation is clear.
Both of the 2026 failures, then, exhibit specific framework-readable patterns. Metropolitan Capital was an extreme low-saleability asset concentration that papered over its underlying fragility through opaque commercial real estate and private equity exposures. Community Bank and Trust was an institution under formal supervisory action whose failure timeline was effectively visible in the public regulatory record one month before it occurred. Neither failure was a bolt from the blue. Both were the late-stage manifestation of stresses that the framework's diagnostic apparatus is designed to identify.
The two 2025 failures — Pulaski Savings Bank (Chicago, closed January 17, 2025, $49.5 million in assets) and Santa Anna National Bank (Texas, closed June 27, 2025, $63.8 million in assets) — were both small. Pulaski's failure cost the FDIC's Deposit Insurance Fund $28.5 million, or roughly 58% of the bank's assets — the most expensive bank failure since at least 2019 on a percentage basis. Santa Anna's failure was reportedly driven by losses related to fraud. Both failures, in framework terms, indicate that the smallest community banks remain genuinely fragile even when the headline count is low. These are the banks for which any meaningful asset shock — credit concentration, fraud, fee-income compression — translates directly into capital impairment because they lack the diversification of larger institutions.
What everyday people should expect
The framework's diagnostic reading should translate, for a general reader, into specific practical observations that inform their own financial decisions.
The first observation is straightforward. A two-failure-per-year reading does not indicate that depositors should change their banking behavior. FDIC insurance covers deposits up to $250,000 per depositor, per insured bank, per ownership category. The mechanics of resolution under FDIC receivership have been refined across forty-plus years and operate reliably. Even in the SVB case, where the bank had a high concentration of uninsured depositors, the resolution was completed without any depositor losses (through the systemic risk exception that protected uninsured deposits). The framework does not advise readers to spread deposits across many banks or to convert deposits to other instruments out of immediate concern about loss of FDIC-insured funds.
The second observation is more substantive. The conditions that produce two-failure-per-year readings have, in the prior two instances, preceded clustered failure events at a 12–24 month horizon. This is not a prediction of imminent crisis, and the framework explicitly avoids that kind of prediction. It is an observation that the substitute-layer support keeping the failure count low has limits, and the framework's reading of the underlying stress indicators (unrealized losses, problem bank list growth, CRE delinquency divergence, NDFI exposure expansion) is that the system is approaching one of those limits rather than receding from it. A reader who finds this analysis credible would reasonably want to be slightly more attentive to the FDIC's quarterly publications, to the specific institutions where they hold uninsured deposits, and to the regulatory enforcement record of any community or regional bank in which they have substantial exposure.
The third observation concerns the broader monetary architecture. The substitute layer that is currently suppressing the failure count is, in framework terms, the same substitute layer that was discussed in Article 8 of this series — the agency MBS market, the $2.2 trillion of agency MBS still held on the Federal Reserve's balance sheet, the implicit federal credit enhancement underneath the agency wrapper, the broader infrastructure of forbearance and supervisory engagement. The framework's reading of this architecture is that it can run in its current configuration for some time but cannot run indefinitely. When the architecture's saleability decays — through duration crisis, through inflation pressure on rates, through the cryptographic substrate concerns of the post-Q-Day environment, through any of the failure modes the framework has identified across the rest of this series — the suppression of the failure count will end. The framework cannot predict which specific failure mode arrives first or when, but it can predict that the current configuration is not stable on the time horizons that household financial planning operates on.
The practical translation is that gold, well-managed dollar-pegged stablecoins, diversified equity exposure, and physical assets with direct saleability remain the appropriate framework-aligned positions for households whose primary concern is preservation of purchasing power across the next several years. The framework's housing trilogy and broader analysis remain operative. The framework does not advise dramatic action; it advises informed positioning that recognizes the structural reality the failure count is currently obscuring.
What this series will track
The Watching the Cracks series will produce articles on a continuing basis as the diagnostic data evolves. The specific signals to be tracked include:
The FDIC Quarterly Banking Profile, released approximately 60 days after each quarter end. The Q1 2026 release in late May 2026 will be the next significant data point. The framework's specific points of interest in each release: unrealized loss progression, problem bank list growth, NDFI loan exposure, CRE delinquency by property type and bank size, and net interest margin pressure on community and regional banks.
Each subsequent bank failure as it occurs, with framework-specific attention to the 30-day-pre-failure regulatory action pattern, the asset concentration profile, and the cost-to-DIF percentage. The framework will track whether the failure count begins to rise (which would indicate substitute-layer compression) or whether the count remains in the 2–3 per year range (which would indicate continued suppression).
Federal Reserve enforcement actions against bank holding companies, captured from the public regulatory record. Each action is a leading indicator that warrants tracking individually. The framework will publish a running watchlist of holding companies under active enforcement, with framework-readable assessments of which actions are most likely to precede resolution events.
The 2026 commercial real estate maturity wall as it progresses through the year. The $875 billion of CRE debt maturing this year is unprecedented in scale, and the disposition of those maturities — refinanced, modified, foreclosed, or worked out — will be visible in the loan-modification reporting of major bank holders. The framework will track this monthly through the rest of the year.
Treasury auction stress signals — primary dealer takedowns, indirect bidder participation, and tail behavior at long-end auctions. These are not bank-failure signals directly, but they are framework-readable indicators of substitute-layer integrity at the federal level, with downstream implications for the bank balance sheets exposed to the same Treasury market.
Cross-references to the Mengerian Stress Index, the diagnostic apparatus proposed in Article 12 of this series. As the MSI dashboard implementation progresses, articles in this series will increasingly anchor their analysis in MSI readings, providing readers with a consistent framework-aligned indicator that integrates the various signals being tracked.
The broader frame
The failure of two banks per year is not, by itself, a crisis signal. The framework does not treat it as one. What the framework treats as the actual signal is the combination of the low failure count with the structural stress indicators that would normally accompany a much higher failure count. That combination is the signature of substitute-layer support. The substitute layer can absorb stress for extended periods. Eventually, the absorbed stress exceeds the layer's capacity to absorb. The framework cannot predict the timing of that crossover. The framework can describe what the empirical signals look like when the crossover is approaching, and the current readings are consistent with the same configuration that has, in two prior instances, preceded clustered failure events.
This is what watching the cracks looks like in framework terms. The cracks themselves are visible in the data. The framework's job is to read them correctly while the reading is still useful — before the substitute layer's capacity is reached, before the suppressed failures arrive in clusters, before the conditions that produced the current "calm" reveal themselves as having been the late phase of a different kind of accumulation. Conventional analysis is reading the failure count and concluding that the system has stabilized. The framework is reading the same data and concluding something else.
The next installment of this series will engage the Q1 2026 Quarterly Banking Profile when it is released. The framework's specific advance prediction, recorded here for testing: the Q1 release will show the problem bank list at 62–66 banks (continuing the upward trend from 57 → 60), unrealized losses in the $310–340 billion range (depending on where rates closed the quarter), and CRE delinquencies at or above the Q4 2025 reading of 1.58% on a bank-held basis (with the underlying CMBS data already showing record-high office delinquencies). If the framework's reading of the current configuration is correct, none of these readings should improve materially from Q4 2025.
The data will be available in late May. The framework will be ready to read it. The watching continues.
This is the first installment of "Watching the Cracks," an open-ended series within the New Austrian Economics catalog that tracks the early warning signs of system stress as they emerge in the empirical record. Subsequent installments will engage specific data releases and discrete events as they occur. The series complements the closed thematic series (Foundational Six, Housing Trilogy, Cryptocurrency Trilogy) by providing real-time application of the framework rather than completed analytical arcs. All twelve prior essays plus the bridge piece remain available at newaustrianeconomics.com.