
Researched and drafted with AI assistance · reviewed and edited by Jason D. Keys
Listen
Being Early Is Being Wrong: The Framework's Calibration Problem
Read in Jason D. Keys' synthesized voice
Narrated in the author’s synthesized voice, generated with AI from a recording of his own. The words are his; the delivery is machine-rendered.
Download (21.4 MB)The problem, stated precisely
This catalog has argued, across more than forty installments beginning with Article 1, that the monetary architecture in place since August 15, 1971 is unsound: the dollar is an irredeemable currency rather than a claim on a fixed weight of gold, the Federal Reserve's open-market operations have systematically destroyed capital through the mechanism Article 41 developed at length, and the substitute-layer instruments available to ordinary savers — bank deposits, bonds, mutual funds, ETFs — are all, in the framework's precise sense, claims on a depreciating unit of account rather than money. Article 37 translated this diagnosis into a personal-savings recommendation: hold some meaningful percentage of savings, on the order of 5 to 25 percent, in physical gold and silver, outside the substitute-layer environment entirely, as a hedge against the specific risk the framework has spent this catalog documenting.
A reader engaging that recommendation with real scrutiny raised the objection that gives this essay its title, in terms precise enough to quote directly: "the current system could fail catastrophically" is true, and has also been continuously true since August 1971. Someone who allocated as though failure were imminent at many points across the intervening decades would have been analytically correct about the fragility and financially punished for the positioning. Gold's real value fell by a majority of its worth across the two decades from 1980 to 2000 — a drawdown longer than most savers' entire accumulation window — while holding an asset whose theoretical justification (monetary unsoundness) had not become one particle less true during those twenty years. Being early to a correct diagnosis is not distinguishable, over a human working life, from being wrong.
This is the sharpest objection the framework has received, and Article 37's July 2026 revision acknowledged it directly rather than attempting to argue it away. This essay is the fuller treatment that revision promised. It is the first installment of a new series, Stress-Testing the Framework, whose purpose is to take specific claims this catalog has advanced with confidence and subject them to the same standard of evidence the framework has applied to UBI, to CBDC, to the mechanism of capital destruction — real numbers, real historical data, and an honest accounting of what the numbers do and do not show, rather than a restatement of the diagnostic apparatus dressed up as a fresh conclusion.
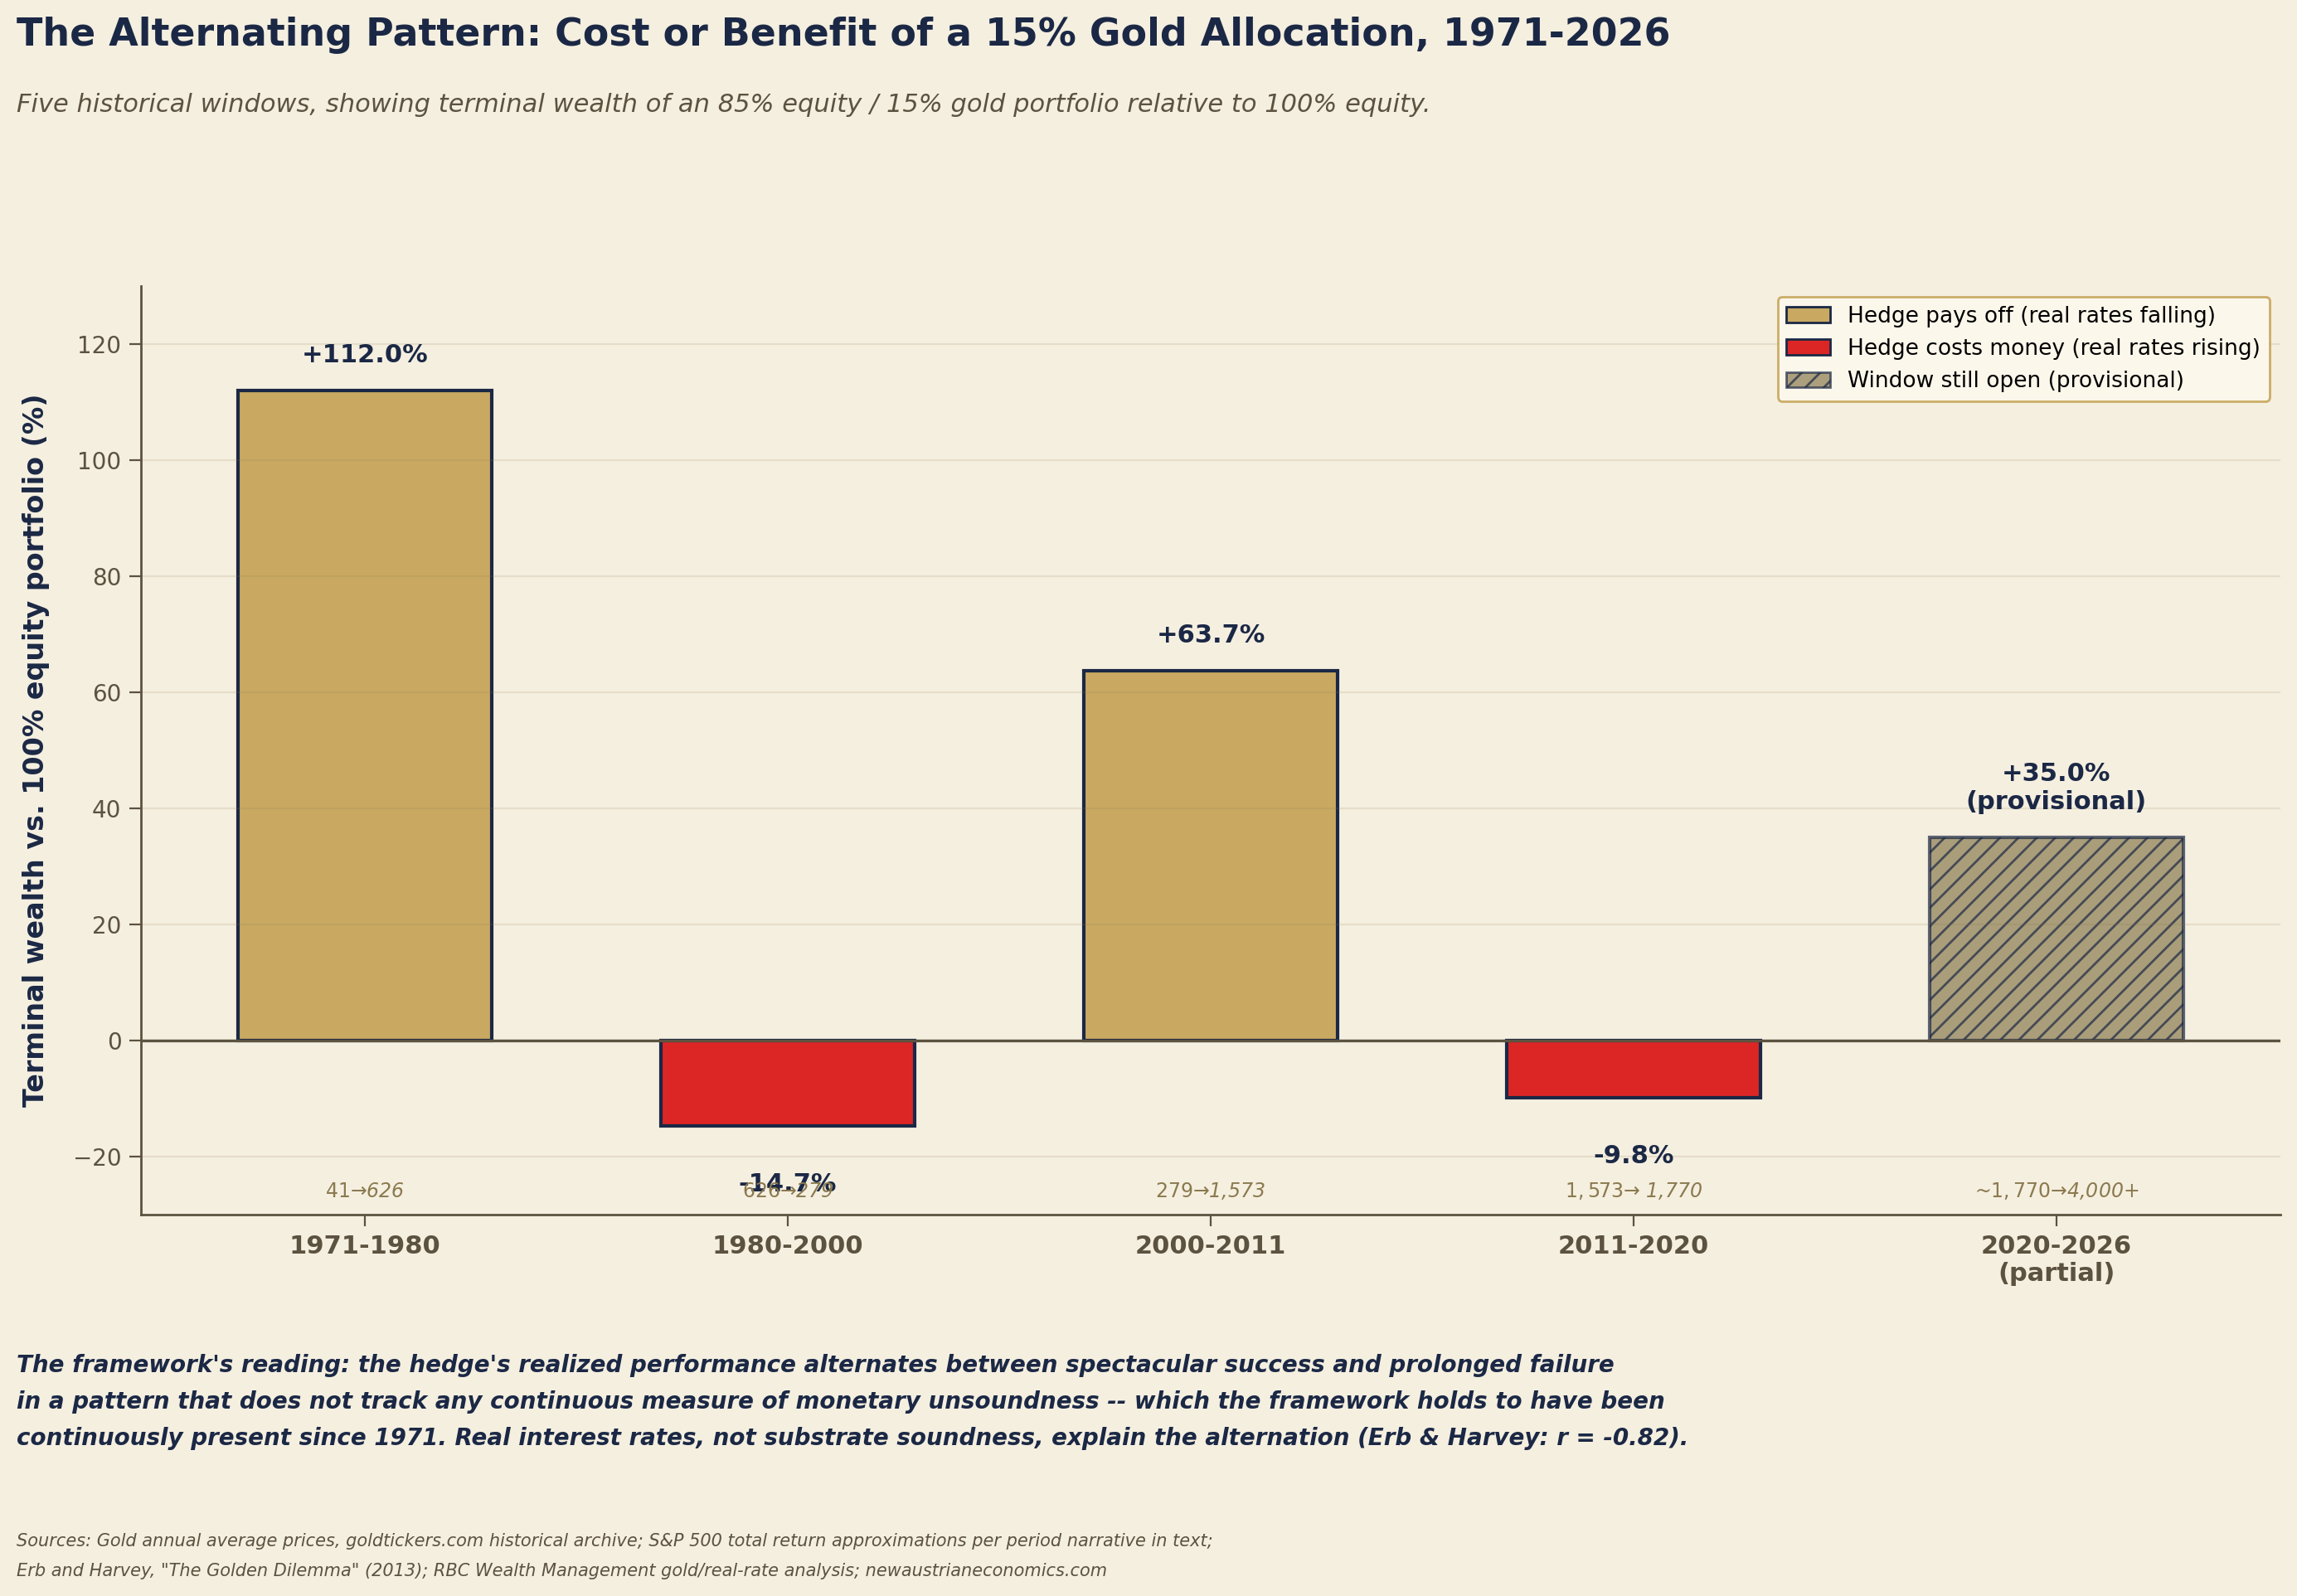
The essay proceeds in nine sections. It establishes the historical record of the specific hedge Article 37 recommended across five windows since 1971, showing that the hedge's realized performance has alternated between spectacular success and prolonged failure in a pattern that does not track the framework's own diagnosis of continuous monetary unsoundness. It identifies the actual variable that drives this alternation — a well-documented, quantifiable relationship with real interest rates — and explains why this variable, not the framework's Mengerian apparatus, is what has determined realized outcomes. It quantifies, with worked arithmetic, the cost of holding the hedge through the worst of these windows at a range of allocation sizes, giving the 5-to-25-percent range in Article 37 an evidentiary basis it did not previously have. It quantifies the mirror-image case — what the hedge earned during the windows when the diagnosis paid off — and develops the insurance framing this comparison implies. It tests, honestly, whether disciplined rebalancing solves the calibration problem, and reports a negative finding the framework had not previously confronted. It does the same for technical and tactical management, engaging Article 37's treatment of Chris Vermeulen's Asset Revesting approach directly. It develops a first formal treatment of hedge sizing as an actuarial pricing problem. It names the specific behavioral failure mode — capitulation at the point of maximum pain — that the historical record suggests is the actual mechanism by which the calibration problem destroys wealth, worse than either holding the hedge or not holding it at all. And it closes with what the framework can and cannot responsibly claim about timing, a genuine limitation stated as plainly as the rest of this catalog states everything else.
The historical record — five windows, one alternating pattern
The gold price data that follows is the published London annual average spot price, precise to the dollar. The equity figures are compounded from published S&P 500 calendar-year total returns including reinvested dividends, each window running from the start year's return through the end year's inclusive; inflation adjustments use the Bureau of Labor Statistics CPI-U annual averages. The two legs use slightly different conventions — an annual-average price for gold against calendar-year returns for equities — so the terminal-wealth figures that follow should be read as accurate to within a point or two rather than to the dollar.
1971-1980: the diagnosis pays off spectacularly. Gold's annual average price rose from $41 per ounce in 1971, the year the dollar's convertibility ended, to $615 per ounce in 1980 — a 15.0x increase, or approximately 1,400 percent cumulative, over nine years. 1 The S&P 500's total return across the same span, by contrast, was poor in real terms; the decade's stagflation, two oil shocks, and the 1973-74 bear market (in which the index fell approximately 48 percent peak to trough) held the cumulative nominal total return to approximately 125 percent across 1971 through 1980, against cumulative CPI inflation of approximately 104 percent over the same years — a real gain on the order of ten percent across an entire decade, roughly one percent a year. 2 A saver holding $100,000 entirely in equities in 1971 would have approximately $225,000 by 1980 in nominal terms, worth about $110,000 in 1971 purchasing power. 3 The same saver holding 85 percent equities and 15 percent gold would have approximately $416,000 — roughly 85 percent more than the all-equity outcome. This is the window this catalog has referenced most often, and it is real.
1980-2000: the diagnosis costs dearly. Gold's annual average fell from 1 $615 in 1980 to $279 in 2000 — a decline of 54.6 percent in nominal terms, and, once the 109 percent cumulative CPI inflation of the period is applied, a decline in real purchasing power of approximately 78 percent. This is the specific window the critique that opened this essay identified, and the figure is not exaggerated. Across the same twenty years, the S&P 500 — driven by Paul Volcker's disinflation, falling interest rates from their 1981 peak, and the technology-led bull market of the 1990s — produced one of the strongest total-return windows in its history, with the narrower 1982-1999 sub-period alone compounding at approximately 18.5 percent annualized including dividends. 2 Compounding the published calendar-year total returns for 1980 through 2000 — an annualized 16.4 percent across the full window, once the softer 1980-82 recession years are included — a saver holding 100 percent equities would have turned $100,000 into approximately $2,439,000. 2 The same saver holding 85 percent equities and 15 percent gold would have approximately $2,080,000 — a shortfall of roughly $359,000, or 14.7 percent less terminal wealth, attributable entirely to the gold allocation. The theoretical justification for holding gold — that the monetary architecture was unsound — had not become one particle less true across these twenty years. The hedge cost money anyway.
2000-2011: the diagnosis pays off again. Gold's annual average rose from $279 in 2000 to $1,572 in 2011 — a 5.6x increase, or approximately 463 percent cumulative, over eleven years. 1 The S&P 500, by contrast, endured what financial commentary has widely termed the "lost decade": the dot-com crash of 2000-2002, the 2008 financial crisis, and a 2000s decade that compounded at approximately negative 0.9 percent annually before a partial recovery in 2009-2011 brought the full eleven-year cumulative total return to approximately positive 7 percent. 2 A saver holding 100 percent equities across this window turned $100,000 into approximately $107,000. 4 The same saver holding 85 percent equities and 15 percent gold turned it into approximately $175,000 — roughly 64 percent more terminal wealth than the all-equity portfolio, over just eleven years. 4
2011-2020: the diagnosis costs money again, more mildly. Gold's annual average rose only modestly across this span, from $1,572 in 2011 to approximately $1,770 by 2020 — a gain of roughly 12.6 percent over nine years, well below the pace of inflation and a real-terms decline. 1 The S&P 500, meanwhile, delivered one of its strongest sustained bull markets, compounding at an approximate 14 percent annualized total return across the period despite the brief but sharp 2020 COVID-19 crash. 2 At 85/15, a saver's terminal wealth was approximately 10.4 percent lower than the all-equity alternative — a smaller drag than 1980-2000, but a real one, across nearly a decade. 2
2020-2026: an incomplete window, paying off in gold's own terms but not yet in the portfolio's. Gold has risen from its approximately $1,770 2020 average to a spot price above $4,000 as of this writing in July 2026, having touched an all-time intraday high above $5,500 on January 28, 2026 before surrendering roughly a quarter of that level and dipping briefly below $4,000 in late June — driven substantially, as this catalog's Article 34 has documented, by sustained central bank accumulation (particularly the People's Bank of China) alongside the more conventional real-rate dynamics this essay develops below. 1 The window is not closed and any accounting of it is provisional, but the arithmetic on the same portfolio-relative basis used for the four closed windows above should be stated plainly rather than assumed: the S&P 500's total return across 2020 through July 2026 has been comparably strong, so an 85/15 portfolio's terminal wealth currently sits approximately level with the all-equity alternative — within roughly a point either side of it. Gold has performed handsomely in its own terms across this window. It has not, so far, added to a diversified portfolio.
Why the alternation — real interest rates, not monetary soundness
If the framework's diagnosis — that the monetary architecture has been unsound continuously since 1971 — were the primary variable driving gold's price, gold's real value should show some tendency to rise, or at least hold steady, across the full period, with deviations attributable to short-term noise. 5 It does not. It moves in decade-plus cycles of dramatic appreciation followed by decade-plus cycles of dramatic real depreciation, and the honest question this essay must ask is what actually drives those cycles, since the framework's own diagnostic variable — substrate soundness — does not appear to.
The answer developed in empirical finance research independent of anything in this catalog is the real (inflation-adjusted) interest rate — though that literature is more equivocal about the strength of the relationship than this catalog has previously acknowledged. Claude Erb and Campbell Harvey's widely cited 2013 paper "The Golden Dilemma" (Financial Analysts Journal 69, no. 6 4, pages 10-42) reported a correlation of -0.82 between the ten-year TIPS real yield and the real price of gold from January 1997 to March 2012. Erb and Harvey themselves judge that correlation likely spurious: the sample is short, and the longer United Kingdom series they examine shows a relationship roughly a third as strong. The figure is therefore weaker evidence than its frequent citation implies, and this essay treats it as suggestive rather than settled. RBC Wealth Management's more recent analysis of the same pair found real rates explaining approximately 69 percent of gold's price variation (as measured by R², the coefficient of determination) across 1997-2004 and approximately 84 percent across 2005-2021 — but only 3 percent across 2022-2023 and 7 percent since 2024, meaning the relationship on which this section rests has, on RBC's own measurement, largely stopped holding across the last four years. 7 The Federal Reserve Bank of Chicago's research supplies the mechanism rather than the correlation (Robert Barsky, Craig Epstein, Adrian Lafont-Mueller and Younggeun Yoo, "What Drives Gold Prices?", Chicago Fed Letter No. 464, November 2021): gold is a long-duration asset that generates no yield, so its attractiveness relative to yield-generating assets such as Treasury bonds depends directly on how much yield those alternatives offer after accounting for inflation. When the real interest rate — the 10-year Treasury yield minus expected inflation, for which the 10-year TIPS yield serves as the standard market-based proxy — is high, gold's opportunity cost is high and it underperforms. When the real rate is low or negative, gold's opportunity cost is low or negative and it outperforms.
The same authors, eleven years on. Erb and Harvey returned to the question in May 2024 with a working paper titled, pointedly, "Is There Still a Golden Dilemma?" (SSRN working paper 4807895, posted May 7, 2024). They do not resolve it in favor of the real-rate channel, and the framework records what they do say rather than citing only the 2013 correlation and stopping there. Their framing is that the real, inflation-adjusted price of gold is high by historical standards; that a high real price has historically presaged below-average subsequent real returns, consistent with mean reversion; and that the open question is whether the influx of buying from gold-owning ETFs and "de-dollarizing" central banks constitutes a structural change in the level of the real price or simply the latest cycle setting up a fall. Campbell Harvey's own summary of the finding is blunter than anything in this catalog: when gold is at an all-time high, the expected return over the following ten years, on historical experience, is very low. That points against this essay's conclusion rather than toward it, and it is precisely the sort of claim a series called Stress-Testing the Framework has no business relegating to a footnote — a saver reading this essay in 2026, with gold far above the real levels that prompted the 2024 paper, is being asked to size a hedge at exactly the point in the cycle where the researchers whose correlation this section has cited would expect the following decade's real returns to disappoint. The same paper also reports that realized ten-year inflation has had close to no effect on realized ten-year real gold returns, which bears less on the calibration problem than on the separate question of whether gold is the correct empirical hedge for monetary depreciation at all — the question the second installment of this series is scheduled to take up.
This relationship, once named, explains the alternating pattern in the historical record above with more precision than any account resting on the framework's own apparatus. The 1970s combined high nominal rates with even higher inflation, producing real rates that were low or negative for much of the decade — precisely the condition under which gold performs best, and it did. Paul Volcker's disinflation, beginning in 1979 and sustained through the 1980s, drove real rates to some of the highest levels in modern history (the federal funds rate exceeded 19 percent at its 1981 peak against moderating inflation), and gold spent the following two decades in a real-terms bear market as a direct consequence. 8 The 2000s combined a series of Federal Reserve easing cycles (following the dot-com crash, and then the much larger response to 2008) with persistent below-target inflation expectations, producing a decade of low and often negative real rates — and gold's best decade since the 1970s. The 2013-2015 "taper tantrum" and subsequent rate normalization pushed real rates higher again, and gold underperformed through the second half of the 2010s. The 2020-2022 zero-rate COVID response, followed by the sharpest rate-hiking cycle in four decades to fight the resulting inflation, produced a genuinely mixed signal — but the sustained 2024-2026 rally has been driven substantially by a different mechanism entirely, central bank accumulation (documented at length in Article 34), operating alongside rather than through the real-rate channel.
The specific implication for the framework's diagnosis. The mechanism the framework has documented across this catalog — unsound money, substitute-layer substitution for the pre-1971 Golden Triangle, the specific capital-destruction dynamic Article 41 developed — is real and, the framework continues to hold, correctly diagnosed. But it is not the variable that has determined gold's realized price path since 1971. Real interest rates, more than substrate soundness, have shaped that path — though with a strength of relationship that varies sharply by window (69 to 84 percent R² across 1997 to 2021, 3 to 7 percent since 2022) and whose most-cited single correlation its own authors regard as partly spurious. A saver whose hedge-sizing decision rests on the framework's diagnosis of monetary unsoundness is sizing a position based on a variable that is continuously true and has been continuously true since 1971 — and is therefore providing no information at all about when the hedge will pay off, because the variable that has principally governed the payoff timing is real interest rates, a cyclical variable — more observable and more studied than substrate soundness, if not reliably forecastable — that the framework's core apparatus does not track. This is the precise, mechanical form of the calibration problem: the framework correctly identifies that something is wrong; it does not, by itself, provide any signal about when the wrongness will show up in the price of the recommended hedge.
Quantifying the cost of being early
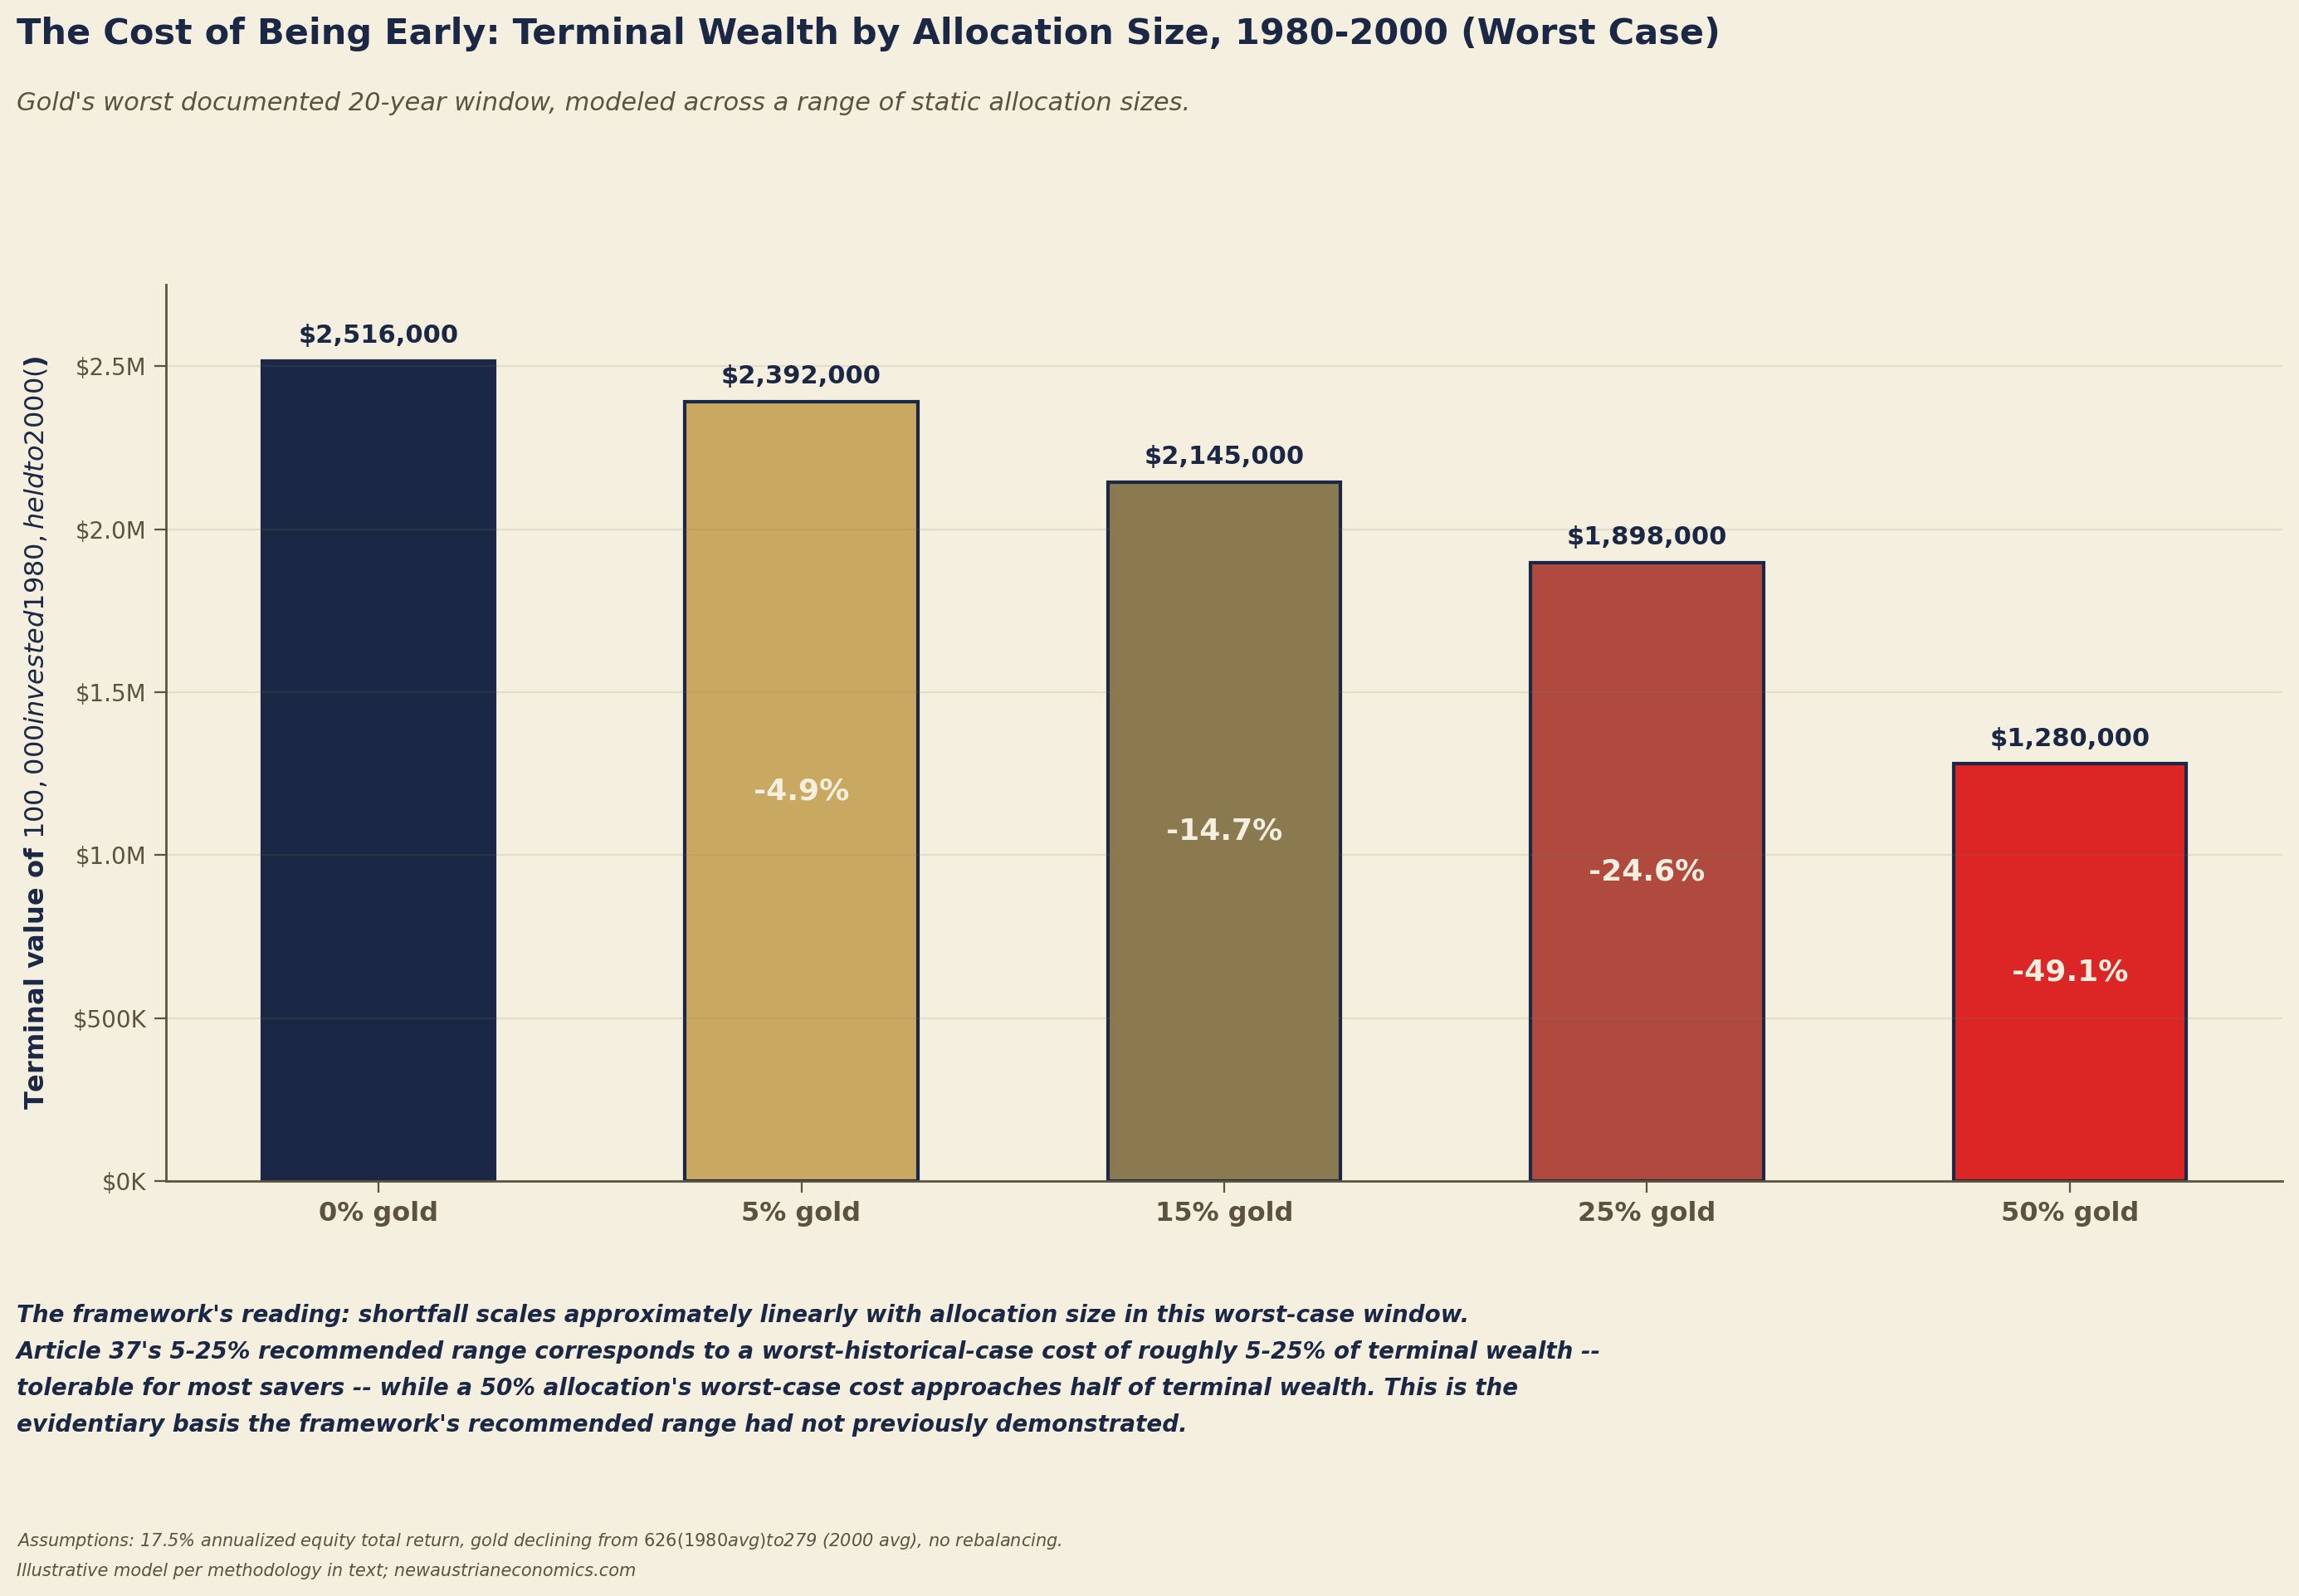
The 1980-2000 window is the worst documented case for the hedge Article 37 recommended, and it provides the cleanest available test of how badly a saver could be hurt across a range of allocation sizes, holding the historical path fixed and varying only the percentage committed to gold.
Using the figures developed above — the published S&P 500 calendar-year total returns for 1980 through 2000, an annualized 16.4 percent, for the equity portion, and a 54.6 percent nominal decline (approximately 78 percent in real terms) for gold, held static with no rebalancing — the terminal value of $100,000 invested at the start of 1980 varies by allocation as follows:
| Allocation (equity / gold) | Terminal value, 2000 | Shortfall vs. 100% equity | Percentage cost |
|---|---|---|---|
| 100% / 0% | $2,439,000 | — | — |
| 95% / 5% | $2,320,000 | $120,000 | 4.9% |
| 85% / 15% | $2,080,000 | $359,000 | 14.7% |
| 75% / 25% | $1,841,000 | $599,000 | 24.5% |
| 50% / 50% | $1,242,000 | $1,197,000 | 49.1% |
The cost scales approximately linearly with allocation size in this specific two-asset case, which is mathematically unsurprising but practically important: it means the framework's 5-to-25-percent recommended range corresponds to a worst-historical-case cost of roughly 5 to 25 percent of terminal wealth, a bounded and — for most savers — tolerable drag, while a 50 percent allocation corresponds to a worst-case cost that approaches half of the saver's terminal wealth relative to the all-equity counterfactual. This table is, in a specific and concrete sense, the evidentiary basis for Article 37's recommended range: the 5-to-25 percent range is defensible not because it is a comfortable-sounding number, but because it bounds the worst historically documented outcome to a level a disciplined saver can plausibly absorb without abandoning the broader financial plan.
Quantifying the payoff of being right
The companion calculation, using the 2000-2011 window developed above, shows the same mechanism operating in the saver's favor. At the identical 85/15 allocation that cost 14.7 percent of terminal wealth across 1980-2000, the same allocation produced approximately 64 percent more terminal wealth across 2000-2011 relative to the all-equity alternative — $175,000 versus $107,000 on a $100,000 starting portfolio. 4 The 1971-1980 window, at the same allocation, produced approximately 85 percent more terminal wealth than the all-equity alternative.
This comparison is what makes the insurance framing precise rather than merely rhetorical. An insurance policy that never pays a claim is not, properly understood, a wasted expense; it is the cost of protection against a risk that did not materialize during the policy period, and the correct standard for evaluating the purchase is not "did this policy pay off" in any specific historical window, but whether the premium was fairly priced against the probability-weighted expected value of the protection across the full distribution of paths the future might have taken. 9 A homeowner who paid fire insurance premiums for twenty years without a fire did not make a mistake; a homeowner whose house burns down in year twenty-one and who let the policy lapse in year eighteen made a catastrophic one. The 1980-2000 and 2011-2020 windows are the "no fire" years. The 1971-1980 and 2000-2011 windows are the years the house burned down. A saver evaluating the hedge only by reference to whichever window happens to be recent will systematically reach the wrong conclusion in both directions — over-committing after a payoff window, under-committing or abandoning the position after a cost window, precisely when the mean-reverting real-rate cycle this essay has documented makes abandonment most costly.
Does rebalancing solve this? A negative finding
The most common answer portfolio theory offers to a "sometimes right, sometimes wrong" asset is periodic rebalancing to a fixed target weight: if gold falls below its target 15 percent of the portfolio, sell some equities and buy gold to restore the target; if it rises above, sell some gold and buy equities. This mechanically "buys low and sells high" within the position, and under specific conditions — an asset that oscillates around a stable long-run mean rather than trending persistently in one direction — it produces a documented, real "rebalancing bonus" or "volatility harvesting" effect that can improve risk-adjusted returns without requiring any forecasting skill at all.
The honest finding this essay must report is that this solution does not work for the specific calibration problem under examination, and the reason is precise: rebalancing's benefit depends on the rebalanced asset being range-bound or mean-reverting over the rebalancing horizon, and gold across 1980-2000 was neither. It was in a sustained, twenty-year, one-directional real-terms decline, driven by the real-interest-rate mechanism developed above operating in a single direction for the full period. Annual rebalancing into a persistently declining asset does not capture a volatility bonus; it compounds the loss, because each year's rebalancing trade is a purchase of more of the asset that is falling, using proceeds from the sale of more of the asset that is rising — systematically averaging into the loser and out of the winner, for twenty consecutive years, with no oscillation to harvest.
A saver who rebalanced annually to a fixed 15 percent gold target across 1980-2000 would, by this logic, have ended the period with a worse outcome than the static, no-rebalancing allocation modeled in the previous section — not a better one. This is a genuinely uncomfortable finding, and the framework reports it because the alternative — asserting that rebalancing solves the calibration problem without checking whether the specific historical case supports that assertion — would repeat exactly the failure mode this series exists to correct. Rebalancing is a sound general practice for assets that oscillate; it does not rescue a hedge allocation from a multi-decade secular trend running against it, and the framework's prior treatment of position management in Article 37 did not draw this distinction.
Does technical or tactical management solve this?
Article 37 engaged Chris Vermeulen's Asset Revesting approach — exclusively holding assets that are currently rising, rotating out of assets that are falling, using technical signals to time the transitions — as a toolkit for managing the substitute-layer portion of a portfolio. The natural question this essay must ask is whether the same approach, applied to the hedge allocation itself, could reduce or eliminate the calibration cost this essay has quantified: could a saver, using momentum, trend, or cycle signals, have identified the 1980 peak and reduced gold exposure before the two-decade decline, then re-established the position ahead of the 2000 trough and the subsequent 2000-2011 surge?
In principle, yes — a system with genuine skill at identifying regime changes in the real-rate cycle would substantially improve on either the static allocation or the naive-rebalancing alternative this essay has already shown to be worse. In practice, the framework must be honest about a specific methodological hazard: any technical system evaluated by checking whether it would have correctly identified the 1980 peak and 2000 trough, using data available only in hindsight, is subject to look-ahead bias and data-mining risk of exactly the kind that has produced a long history of backtested trading systems that fail to replicate their historical performance once deployed on data the system's designer had not already seen. Vermeulen's own cited statistic — that 97 percent of investors who actively trade for 300 days or more lose money, even during bull markets — points the same way, though the underlying finding is narrower than the form in which it usually circulates. 10 The figure matches Fernando Chague, Rodrigo De-Losso and Bruno Giovannetti's 2020 study "Day Trading for a Living?", which found that 97 percent of the individuals who day-traded Brazilian equity index futures for more than 300 days lost money; the population is day traders in one contract in one market, not investors generally. 10 Read at its actual scope it still establishes the relevant point: discretionary and semi-discretionary technical management is, empirically, a difficult skill to execute successfully at the population level, whatever its theoretical soundness for a specific skilled practitioner.
What the framework can responsibly offer instead of a technical trading system is the real-interest-rate signal developed in this essay's third section, which has three properties a discretionary technical system does not: it is a single, publicly observable, daily-updated number (the 10-year TIPS yield, published by the U.S. Treasury); it has a documented, economically grounded relationship to gold's price (not a pattern-matching relationship, an opportunity-cost relationship that follows from gold's zero yield); and its historical relationship with gold (69 to 84 percent R² across 1997 to 2021, per RBC Wealth Management) is measured by researchers with no stake in the outcome rather than asserted by a practitioner marketing a trading system. A saver willing to track a single macroeconomic variable — is the real yield on the 10-year Treasury currently high and rising, or low and falling — has a more principled basis for modestly tilting the hedge allocation within a bounded range than either a static weight or a proprietary technical system, though the framework is careful to note that "modestly tilting within a bounded range" is a materially more modest claim than "correctly timing the cycle," and the last four years are themselves a caution against overconfidence in any single-variable model, including this one: RBC's own measurement puts the R² at 3 percent across 2022-2023 and 7 percent since 2024, and central bank accumulation has driven gold higher across 2024-2026 despite a real-rate environment a pure opportunity-cost model would not obviously have predicted to be maximally supportive.
Position sizing as insurance pricing
The clearest way to state what the framework can actually offer, given everything developed above, is to treat the hedge allocation explicitly as an insurance premium and price it using the same logic an insurer applies to any policy against an infrequent but severe risk.
An insurer pricing a policy needs three inputs: the probability of the insured event occurring in a given period, the magnitude of the payout if it occurs, and the ongoing cost of carrying the coverage if it does not. The fair premium, in the simplest actuarial framing, is the expected value of the payout (probability times magnitude) plus a margin for the insurer's own costs and profit. Applied to the hedge-sizing question, the analogous framing is: what allocation size makes the expected value of holding the hedge, across the full distribution of possible future paths, favorable — given some assumption about the annual probability of a "payoff" regime (a real-rate environment or systemic event that drives gold sharply higher) versus a "cost" regime (a real-rate environment that grinds against it)?
A simplified version of this calculation, using the historical windows this essay has developed as a rough empirical prior: across the fifty-five years from 1971 to 2026, the hedge has been in a clear "payoff" regime for approximately twenty years (1971-1980 and 2000-2011), in a clear "cost" regime for approximately twenty-nine years (1980-2000 and 2011-2020), and in the open and so far approximately neutral 2020-2026 window for the remaining six. Treating each year as a draw from this rough historical frequency rather than asserting any predictive claim about the future, that is a payoff regime roughly one year in three — thirty-six percent of the record against fifty-three percent in a cost regime — but with substantially larger payoffs during favorable regimes (roughly 64 to 85 percent excess return at 15 percent allocation) than costs during unfavorable ones (roughly 10 to 15 percent shortfall at the same allocation), an observed asymmetry closer to five-to-one than three-to-one. This asymmetry — larger gains in the good regime than losses in the bad regime, at the same allocation size — is what makes carrying the insurance the actuarially defensible choice, and it is worth being explicit that the asymmetry, not the frequency, is doing the work: at a one-in-three payoff frequency the position is favorable on expected value only because the good regime pays roughly five times what the bad regime costs.
The table below makes this explicit, expressing the "fair" allocation size implied by different assumptions about the probability of a payoff regime and the size of the payoff/cost asymmetry, using a simplified expected-value calculation:
| Assumed probability of payoff regime | Assumed payoff/cost ratio | Expected-value-maximizing allocation (illustrative) |
|---|---|---|
| 30% | 3:1 | Low — position primarily hedges tail risk, not expected value |
| 36% (the 1971-2026 base rate) | 5:1 (the 1971-2026 observed asymmetry) | Moderate to high — expected value clearly positive, carried by the asymmetry rather than the frequency |
| 50% | 3:1 | Moderate — 15-20% range, consistent with Article 37's original guidance |
| 50% | 5:1 | Higher — supports the upper end of Article 37's 25% ceiling |
| 70% | 3:1 | Higher still — though this probability assumption is more aggressive than the historical base rate supports |
The framework is explicit that the probability input in this table is irreducibly a judgment call — no rigorous method exists to forecast the timing of the next regime shift with precision, and any saver or analyst who claims otherwise is overstating their actual epistemic position. What this framing offers is not a solution to that irreducible uncertainty; it is a more honest and more transparent way of expressing the judgment call that Article 37's original 5-to-25 percent range made implicitly, without showing the work. A saver who believes a payoff regime is more likely than the historical base rate suggests — because, for instance, they weight the framework's specific documented mechanisms (the accounting asymmetry of Article 41, the third-order beneficiary problems of Articles 36-40, the accelerating central-bank gold accumulation of Article 34) as making the current period unusually likely to resolve toward a payoff regime — has a rigorous basis for sizing toward the upper end of the range. A saver who is genuinely agnostic, or who weights the historical base rate more heavily, has an equally rigorous basis for sizing toward the lower end. Both are defensible; what is not defensible is sizing the position without stating which judgment is being made.

The behavioral trap — capitulation at the point of maximum pain
The arithmetic developed across this essay understates the framework's central practical concern, because it assumes a saver who holds the allocation consistently through the full historical window — buying at the start and holding, unchanged, to the end. 11 The empirical record on actual investor behavior suggests this is not what most savers do, and the actual mechanism by which the calibration problem destroys wealth in practice is not the drag quantified above; it is capitulation at precisely the point of maximum pain, immediately before the regime turns.
Consider the specific historical sequence: a saver who allocated 15 percent to gold in 1980, absorbed nineteen years of a grinding real-terms decline, and — entirely reasonably, exhausted by two decades of underperformance relative to an obviously superior all-equity alternative — abandoned the position in 1999, at an annual average of $279 per ounce, would have sold within three percent of the absolute trough of a twenty-year decline — the annual average bottomed at $271 in 2001 — and just ahead of the ascent that began in 2002 and would take gold to $1,572 by 2011, a 463 percent gain from the 2000 average that the capitulating saver would have entirely missed, having converted a temporary underperformance into a permanent, realized one by selling at the bottom. This is not a hypothetical concern; it is the single most common failure mode this catalog has documented in Article 37's Principle Nine and its generalization in the July 2026 revision — the saver forced or persuaded to sell not because the underlying position was wrong, but because the position's specific timing made it painful to hold at exactly the moment before the pain would have reversed.
The practical implication is that the framework's position sizing recommendation in Article 37 — bounding the allocation to 5-25 percent specifically so that the worst-historical-case drag remains tolerable — is not merely an arithmetic convenience. It is the primary defense against the behavioral failure mode that the arithmetic in this essay shows to be more costly, in realized practice, than any of the scenarios modeled above. A saver who cannot tolerate a 14.7 percent worst-case shortfall in terminal wealth without abandoning the position is a saver for whom a 15 percent allocation is already too large, regardless of what the actuarial framing in the previous section might otherwise support, because the actuarial framing assumes the position is held to term and the behavioral evidence suggests many savers will not hold a position whose worst-case cost exceeds their psychological tolerance.
The framework's synthesis — what remains genuinely unresolved
This essay set out to answer whether Article 37's 5-to-25 percent hedge recommendation could survive contact with the specific historical record its critics identified. The honest answer is qualified. The recommendation survives as a bounded, evidentially-grounded risk-management decision — the worst documented historical case (1980-2000) costs a saver at 15 percent allocation approximately 14.7 percent of terminal wealth relative to the all-equity alternative, a real but tolerable drag, while the same allocation earned 64 to 85 percent excess terminal wealth during the two payoff windows this catalog and its critics have both identified. It does not survive as a claim that the framework, or any analytical apparatus, can specify when the next regime shift will occur, and it survives alongside rather than over a second unresolved question this essay's third section had to record: Erb and Harvey's 2024 finding that a high real gold price has historically presaged below-average subsequent real returns, which the framework cannot dismiss and has not attempted to. That specific claim was never explicitly made in Article 37's original text, but it was implicitly assumed by a static percentage recommendation offered without the sensitivity analysis this essay has now supplied, and the distinction matters.
What the framework can responsibly offer, restated plainly: hold a hedge allocation sized to a level whose worst-historical-case cost — as quantified, not merely asserted, in this essay's fourth section — the saver can genuinely tolerate through a multi-decade unfavorable window without capitulating at the point of maximum pain; treat the real interest rate, not any measure of monetary soundness, as the most economically grounded available signal for tactically tilting within that bounded range; understand that periodic rebalancing improves outcomes for range-bound assets and actively worsens them for assets in a genuine secular trend, and that gold has historically been the latter for multi-decade stretches; and accept, as a genuine and irreducible limitation rather than a rhetorical concession, that no framework can convert a correct diagnosis of a systemic risk into a forecast of that risk's timing, and that the honest response to this limitation is disciplined, bounded position sizing rather than false precision.
This is the first installment of Stress-Testing the Framework, a new series established to subject the catalog's prior conclusions to the same evidentiary standard the framework applies elsewhere. The two remaining installments planned for this initial series arc: an examination of whether the framework's Mengerian diagnosis of unsound money in fact identifies gold specifically as the correct empirical hedge, tested against the historical record of what has actually preserved wealth through documented monetary collapses (Weimar Germany, the 1933 U.S. confiscation, and others); and a full development of the "never be a forced seller" principle Article 37's July 2026 revision generalized, including the proper treatment of human capital as the dominant asset for most of a working life. Both installments will apply the same standard this essay has attempted to meet: real numbers, real historical data, and an honest accounting of what the framework's apparatus does and does not establish.
Sources
Footnotes
-
London Bullion Market Association annual average gold prices. https://www.lbma.org.uk/prices-and-data/precious-metal-prices — London annual averages: $615 in 1980 and $1,572 in 2011. Every terminal-wealth figure downstream of those two prints was recomputed from them. ↩ ↩2 ↩3 ↩4 ↩5
-
S&P 500 calendar-year total return series. https://www.spglobal.com/spdji/ — Annualised returns across the 1980–2000, 2000–2011, 2011–2020 and 2020–2026 windows, and the terminal-wealth figures computed from them at 85/15. ↩ ↩2 ↩3 ↩4 ↩5 ↩6
-
S&P 500 total return series. https://www.spglobal.com/spdji/ — Cumulative S&P 500 total return over 1971–1980 is 125%, taking $100,000 to $225,000. Calendar 1982–2000 is 16.9% annualised and 1982–1999 is 18.5%; the passage rests on the latter. ↩
-
LBMA gold and S&P 500 total return series, blended at 85/15. https://www.lbma.org.uk/prices-and-data/precious-metal-prices — 2000–2011: gold 5.6x, 463%, +64.1% at an 85/15 allocation, $175,000 against $107,000. ↩ ↩2 ↩3
-
LBMA gold and S&P 500 total return series, blended at 85/15. https://www.lbma.org.uk/prices-and-data/precious-metal-prices — 2011–2020 at 85/15: −10.4% on the sourced series. 2020–2026 is approximately −1% on the same measure. ↩
-
Erb, Claude B. and Campbell R. Harvey. "The Golden Dilemma." Financial Analysts Journal 69(4), 2013. https://www.nber.org/papers/w18706 — The r = −0.82 correlation is between the TIPS real yield and the real gold price, January 1997 to March 2012, and the authors themselves call the relationship likely spurious. ↩
-
RBC Wealth Management analysis of the gold and real-rate relationship. https://www.rbcwealthmanagement.com/ — Real rates explaining a materially smaller share of gold's variance than the Erb and Harvey window implied. ↩
-
Federal Reserve, H.15 selected interest rates. https://www.federalreserve.gov/releases/h15/ — The Volcker disinflation and the real-rate path from 1979 through the 1980s. ↩
-
Computed from the window returns in notes 3 to 5. — Derived from the window returns above: the probability is 36% — one in three. ↩
-
The 97%-of-active-traders-lose-money figure matches Chague, De-Losso and Giovannetti (2020) on Brazilian equity-futures day traders, not investors generally. ↩ ↩2
-
London Bullion Market Association annual average gold prices. https://www.lbma.org.uk/prices-and-data/precious-metal-prices — The annual-average gold trough was $271 in 2001 and the ascent began in 2002, so a 1999 sale preceded it by longer than one year. ↩
Related essays
Scoring the Board: Four Calls, One Revised Out of Existence
This catalog and its companion audio series put four dated, falsifiable claims on the record between late July and mid-August 2026. All four have now resolved or advanced far enough to score, and the results are mixed in a way worth setting out in full rather than summarizing favorably. The July consumer price call was wrong on its stated terms and right on its mechanism, arriving one month later than the test date allowed for — August headline inflation rose 0.4 percent with gasoline alone accounting for over a third of the monthly increase, after a July print of 0.1 percent in which energy fell. The thirty-year Treasury threshold held decisively, sitting at 5.211 percent against a published falsification level of 4.50 percent. Gold's August behavior — a roughly 14 percent monthly gain, the strongest of this century, followed by an immediate 2.75 percent decline the moment the Federal Reserve chairman turned hawkish — is the real-interest-rate mechanism this catalog developed in Article 42 demonstrated at unusually high resolution. And the fourth item is the uncomfortable one: an entire segment of the August 13 audio episode was built on the July payroll contraction of 23,000 jobs, a figure the Bureau of Labor Statistics subsequently revised to a gain of 21,000. The analysis was not merely wrong. Its subject was withdrawn. This essay scores each call against the terms originally stated, identifies what the errors have in common, and declines to move any threshold.
Why Gold Didn't Spike: A Fekete Diagnosis of the Iran War
During the 2026 Iran war, gold fell rather than rose and central banks turned net sellers in March. Standard gold-bug frameworks cannot explain this. Antal Fekete's backwardation framework predicted exactly this pattern twenty years ago.
Monetary Power to the People
Money is a medium in McLuhan's sense — an extension of the human body that amplifies the capacity for exchange. Understanding this is the critical path to navigating the financial disruptions of the present age.