Researched and drafted with AI assistance · reviewed and edited by Jason D. Keys
The number that stopped existing
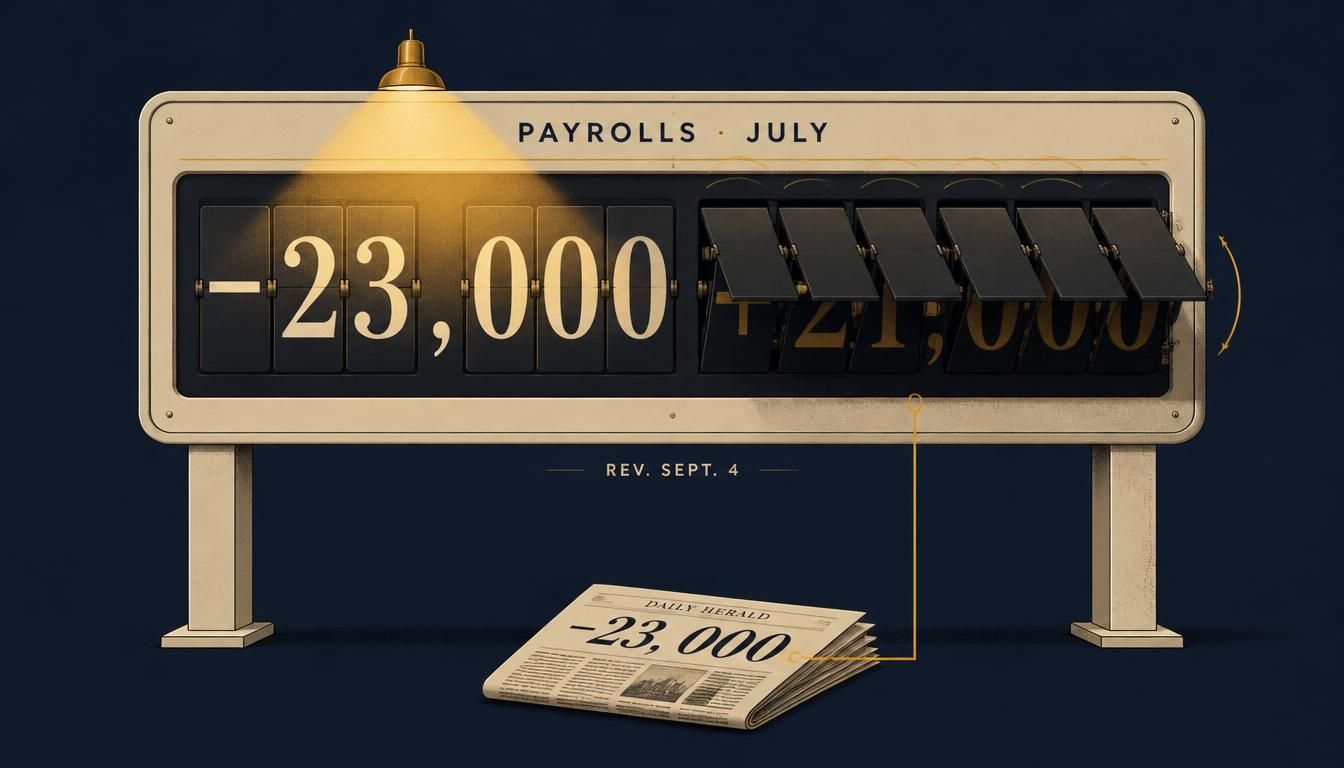
On Friday, August 7, 2026, the Bureau of Labor Statistics reported that total nonfarm payroll employment had declined by 23,000 in July. Economists surveyed by Dow Jones had expected a gain of 83,000. The unemployment rate had nonetheless fallen to 4.1 percent, and labor force participation had dropped to 61.4 percent, the lowest reading in more than five years.
The figure was covered as a contraction. It was read as a turn. It generated a substantial volume of analysis — including, as this catalog recorded in Article 50, an entire segment of its own audio series, which opened: "On August seventh, the American economy lost jobs. Not gained fewer than expected. Lost."
On Friday, September 4, 2026, the same agency revised July payrolls to a gain of 21,000. 1
The revision was 44,000 jobs. It did not adjust the magnitude of the July figure. It reversed its sign. In the same release, June was revised up 11,000, from a gain of 20,000 to a gain of 31,000, leaving June and July combined 55,000 higher than previously reported. 1
For completeness, and because it sharpens rather than softens the point: one month earlier, the August 7 release had revised May and June down by a combined 103,000.
So within the space of two monthly releases, the same two months were revised down by 103,000 and then up by 55,000, and the intervening month's headline figure inverted.
This essay is not about the labor market. It is about what that sequence implies for anyone — analyst, commentator, policymaker, or framework — who forms views from monthly aggregates.
The asymmetry of attention
The structural problem is not that the data is revised. Revision is a feature of honest statistical practice, and the Bureau publishes its methodology, its revision schedule, and its confidence intervals openly.
The problem is that the initial print and the revision are not consumed equally.
A first estimate arrives at 8:30 on a Friday morning with a consensus forecast attached, is transmitted immediately into headlines, moves bond and equity markets within seconds, is quoted by officials, and becomes the factual premise of a week of commentary. The revision arrives a month later, buried in the fourth paragraph of a release whose headline concerns a different month, and reaches a small fraction of the audience that received the original.
The September 4 release illustrates this precisely. The coverage led, correctly, with the August figure of 162,000 against a consensus of 53,000 — more than triple expectations, and the strongest monthly gain since March. 1 2 The July sign reversal appeared as a secondary detail in most accounts.
The consequence is an epistemic ratchet. The first estimate establishes a narrative; the correction, arriving later and quieter, does not dislodge it. Anyone who formed a view in early August that the American labor market had begun contracting, and who did not specifically go looking a month later, still holds that view. The data no longer supports it. The belief persists because the mechanism that created it is louder than the mechanism that corrected it.
What a monthly payroll figure actually is
The precision with which these figures are reported invites a category error worth naming.
Nonfarm payrolls are an estimate derived from a survey of business establishments. They are not a count. The published figure is a point estimate drawn from a sample, subject to sampling error, to the incomplete response of firms at the time of first publication, and to seasonal adjustment factors that are themselves estimated and periodically revised. Later estimates incorporate responses from firms that had not reported by the initial deadline, which is the principal source of the monthly revisions.
The Bureau states the uncertainty openly. What the surrounding apparatus does is discard it. A figure published as "−23,000" is reported as though the economy shed twenty-three thousand jobs, when what the estimate actually supports is something closer to the survey's current best estimate of the change is slightly negative, with a confidence interval comfortably spanning zero.
Those two statements license entirely different claims. The first supports "the American economy lost jobs." The second supports almost nothing on its own, and certainly not a structural argument about labor supply or technological displacement.
The revision to +21,000 did not reveal that the Bureau had erred. It revealed that a figure whose uncertainty band spanned zero resolved, with fuller information, to the other side of zero. That is the system working. The failure was in the reading.
Where this catalog was caught
The framework applies this analysis to itself first, because it has a live instance.
In its August 13 audio episode, this catalog built a full segment on the July contraction. It did so carefully by its own lights — noting the consensus miss, the downward revisions to May and June, the fall in the twelve-month average to 34,000, and the collapse in participation to 61.4 percent. From those figures it argued that the labor market was weakening through the supply side rather than through artificial-intelligence displacement, and it supported that argument with the sector composition of the losses.
The subsequent revisions dissolved most of that. July was a gain. Participation recovered to 61.6 percent and the employment-population ratio to 59.1 percent. 1 Part-time employment for economic reasons fell by 414,000 to 4.4 million. 3 August payrolls printed 162,000 against the prior twelve-month average of 31,000. 1
But the specific failure worth isolating is this. That same segment cited the existence of large revisions as evidence for its argument — the 103,000 downward revision to May and June was offered as corroboration that the labor market was weaker than headline figures suggested — while simultaneously treating the current month's preliminary figure as firm enough to build a structural claim on.
The framework used the unreliability of recent estimates as a premise and the reliability of the newest estimate as a premise, in the same argument, within the same minute of audio.
That is not a subtle inconsistency, and naming it is more useful than the analysis it invalidated.
Why this is the sharper version of Article 20
Article 20 of this catalog argued that official aggregates conceal more than they reveal — that construction choices, definitional decisions, and weighting schemes embed judgments that the headline number presents as fact.
That argument concerns what the aggregates measure. This one concerns when they are believed, and it is a distinct problem that survives even where the construction is sound.
Grant, for the sake of argument, that the establishment survey is well designed, honestly administered, and methodologically appropriate to its purpose. Grant that the Bureau publishes its uncertainty accurately. None of that prevents the failure described above, because the failure occurs downstream of the statistic in the act of reading it — in the conversion of a provisional estimate into a fact about the world at the moment of publication rather than at the point where its revision window has closed.
The two problems compound. An aggregate whose construction embeds contestable judgments, consumed at a confidence its preliminary status does not support, produces claims about the economy that are wrong in two independent ways at once.
The same failure in the inflation data, differently shaped
The parallel case is instructive because the mechanism differs while the error rhymes.
The consumer price index is not revised in the way payrolls are; seasonally adjusted figures are subject to annual recalculation but the headline monthly print is broadly stable. Its analogous weakness is timing: the index reflects prices collected throughout the reference month, so an event occurring in the final days of a month barely registers until the following release.
This catalog made exactly that error, as Article 50 records. In late July it named the August 12 release of July data as the test of whether a July 23–24 oil shock would pass through to consumer prices. It could not have. The collection window made the named test incapable of measuring the named effect. The pass-through duly appeared in the August data, released September 11, where the gasoline index rose 3.9 percent on the month and accounted for over one third of the entire all-items increase. 4
Different mechanism — collection lag rather than sample revision — and the same underlying error: treating a monthly release as a clean window onto the period it nominally covers.
What the framework will do differently
Four rules, stated so they can be enforced against future work in this catalog.
One. A single monthly print is an observation, not a fact. It may be reported, and its consensus miss may be noted. It may not serve as the foundation of a structural claim without explicit acknowledgment of its provisional status.
Two. Structural arguments about the labor market rest on trailing averages or on data past its revision window. The twelve-month average, the three-month moving average, and figures from months whose revisions have settled are admissible. The current month's establishment-survey estimate is not, standing alone.
Three. When naming a test date, verify that the series can register the effect by that date. The collection window of the CPI and the revision schedule of the payroll survey are both documented and both knowable in advance.
Four. Revisions get the same treatment as prints. Where this catalog has built an argument on a figure that is subsequently revised, the revision is reported with the prominence the original claim received. Article 50 is the first application of this rule.
The general case
The specific instance here is a 44,000-job revision, which is a small number in an economy of roughly 160 million workers and which no reasonable person would treat as a scandal.
The general case is what makes it worth an essay. The monthly payroll release is among the most consequential recurring information events in global markets. It moves the entire Treasury curve within seconds of publication. It is cited by central bankers as an input to rate decisions. It shapes the interpretive frame through which the following month of economic news is read.
And its headline figure, in this instance, was wrong about the direction of the change it reported — not by a rounding error, but sufficiently that a gain was published as a loss.
This catalog has argued across fifty installments that the substitute layer interposes claims between savers and the things those claims represent, and that the central analytical discipline is distinguishing a claim from the thing. A statistical estimate is a claim about the economy. It is not the economy. The estimate is frequently the best available claim, which is a reason to use it and not a reason to mistake it for its referent.
The framework got that distinction wrong in August with respect to a number it had every reason to hold loosely, and is recording the correction here so the standard is on the page before the next print arrives.
Sources
Note on the July 2026 preliminary figures. The −23,000 July payroll estimate, the 83,000 consensus, the 61.4 percent participation reading, the 103,000 combined downward revision to May and June, and the 34,000 twelve-month average were reported in the Employment Situation Summary — July 2026, released 7 August 2026, and in contemporaneous coverage. They are cited here as the superseded figures they now are, and are reproduced to document what was published and believed at the time rather than as current estimates of the underlying quantities.
Framework cross-references. Article 20 (official aggregates and what their construction conceals); Article 50 (the scorecard, including the July inflation call and the withdrawal of the payroll analysis); The Framework's Reading Episode 002, 13 August 2026 (where the July contraction segment was recorded).
Footnotes
-
U.S. Bureau of Labor Statistics, Employment Situation Summary — August 2026, released 4 September 2026. https://www.bls.gov/news.release/empsit.nr0.htm — "The change in total nonfarm payroll employment for June was revised up by 11,000, from +20,000 to +31,000, and the change for July was revised up by 44,000, from −23,000 to +21,000. With these revisions, employment in June and July combined is 55,000 higher than previously reported." Also the source for August payrolls of +162,000 against a prior twelve-month average monthly gain of 31,000, labor force participation at 61.6 percent, and the employment-population ratio at 59.1 percent. ↩ ↩2 ↩3 ↩4 ↩5
-
"U.S. payrolls rose 162,000 in August, much more than expected; unemployment rate at 4.1%." CNBC, 4 September 2026. https://www.cnbc.com/2026/09/04/jobs-report-august-2026.html — Source for the consensus expectation of 53,000 and the characterization of August as the strongest monthly gain since March. ↩
-
"August 2026 jobs report: U.S. adds 162,000 jobs, unemployment 4.1%." Quartz, 4 September 2026. https://qz.com/us-jobs-report-august-2026-payrolls-unemployment-090426 — Source for part-time employment for economic reasons falling by 414,000 to 4.4 million, and for the 2 October 2026 release date of the September report. ↩
-
U.S. Bureau of Labor Statistics, Consumer Price Index Summary — August 2026, USDL-26-1496, released 11 September 2026. https://www.bls.gov/news.release/cpi.nr0.htm — "The index for gasoline rose 3.9 percent in August, accounting for over one third of the monthly all items increase." ↩