
A specific empirical observation grounds this essay. The quantitative easing programs that the Federal Reserve operated from late 2008 through 2014 expanded the central bank's balance sheet from approximately $900 billion to approximately $4.5 trillion — a more than fivefold increase in roughly six years. Conventional monetary theory predicted that this expansion would, all else equal, produce consumer price inflation in approximate proportion to the increase. Conventional monetary theory was wrong about the timing — but not about the direction. Inflation did not rise during QE itself. It rose, eventually, in 2021-2022, with peak headline CPI of 9.1% arriving in June 2022, approximately fourteen years after QE began and approximately eight years after QE's expansionary phase ended. The post-COVID monetary expansion compressed this timeline somewhat — federal spending and monetary expansion in 2020-2021 produced consumer price effects within eighteen to twenty-four months — but the basic structural observation held: the price effects of monetary expansion propagated on calendar time, with lags that conventional discussion consistently underestimated.
The framework's catalog has engaged this lag dynamic extensively, particularly in Article 20 (aggregates that lie) where the structural reasons aggregates fail to capture timely price effects were laid out in detail. What the framework has not directly engaged, but what now demands engagement, is the supply-side version of the same problem.
On February 28, 2026, U.S. and Israeli forces launched coordinated strikes against Iranian nuclear, military, and IRGC command infrastructure. Within forty-eight hours, the Strait of Hormuz — the maritime chokepoint through which approximately 20 million barrels per day of oil and approximately 20% of global LNG transit — had effectively closed to commercial shipping. Major carriers (Maersk, MSC, CMA CGM, Hapag-Lloyd) suspended transits within the same window. War risk insurance was cancelled for Gulf transits on March 5. Approximately 150 tankers were anchored outside the strait by mid-March; approximately 500,000 containers were stranded, with roughly 20,000 seafarers stuck on vessels unable to complete voyages. Simultaneously, the Houthi forces in Yemen resumed attacks on Red Sea shipping that had been quieted since the October 2025 ceasefire, taking the Red Sea route to Europe back down to approximately 49% of pre-crisis capacity. For the first time in modern history, both of the Middle East's major maritime corridors are simultaneously blocked.
The shock is real. The headlines have engaged it. The strategic petroleum reserve has been drawn down to compensate — 172 million barrels released by the United States in March 2026 as part of a coordinated 400-million-barrel International Energy Agency response, the largest such coordinated release in history. Brent crude is up approximately 60% since the strikes began. Yet U.S. consumer price inflation prints have remained moderate through April 2026 (3.8% headline, 2.8% core), and the popular financial press has treated the absence of an immediate price spike as evidence that the disruption is being managed.
This essay argues that this reading badly misunderstands the calendar mechanics. The Hormuz disruption is propagating to American household prices on a timeline that closely resembles, in form if not in magnitude, the QE-to-inflation lag that the framework has been documenting across the post-2008 period. The buffers that have absorbed the initial impact — strategic reserves, inventory drawdowns, contract carry-over, hedging programs — are real and consequential, but they are also finite. The empirical pass-through estimates from the academic literature suggest specific timelines for each propagation channel. When those timelines are combined with the buffer-exhaustion math, the resulting forecast points to peak household impact arriving in Q1-Q2 2027, with the trajectory established at that point likely to persist for an additional twelve to eighteen months regardless of when the underlying geopolitical situation resolves.
This is the tenth installment of Watching the Cracks. It proceeds in six sections. First, the structural argument: why supply shocks lag in the same way monetary shocks lag, and what the historical record establishes about the timing. Second, the specific empirical pass-through estimates for each propagation channel. Third, the buffer math: what's been depleted, what remains, and how long it lasts. Fourth, the channel-by-channel propagation timeline. Fifth, the framework's specific forecast — calibrated, time-bounded, and explicitly falsifiable. Sixth, the household implications and the framework's standard guidance applied to this specific shock.
Why supply shocks lag
The conventional model of how a supply shock reaches consumer prices assumes a relatively short transmission window. The shock occurs (an oil embargo, a pipeline rupture, a chokepoint closure); the affected commodity prices rise immediately; downstream producers experience cost increases; producers either absorb or pass on the increases; consumers pay higher prices within a few months. This model is correct in form but consistently wrong in magnitude and timing for shocks that affect the substrate of multiple supply chains simultaneously.
Two specific mechanisms produce systematic lags that the simple model misses.
The buffer mechanism. Modern global commerce operates with substantial inventory and reserve buffers that absorb initial shocks. Oil specifically benefits from approximately 1.2 billion barrels of public emergency stocks held by IEA member countries, plus approximately 600 million barrels of industry stocks held under government obligation. The United States holds (as of May 2026) approximately 392 million barrels in the Strategic Petroleum Reserve, with an additional ~172 million barrels having been released since March and obligated for refilling through 2026-2029. Commercial inventories at refineries, distribution terminals, and retail outlets add additional weeks to months of normal consumption coverage. The shipping sector operates with floating inventory in transit (tankers, container ships) that buffer port-level disruptions. Each of these buffers absorbs the initial shock, allowing the underlying disruption to operate for weeks or months before the propagation reaches retail prices in the affected products.
The contract and hedging mechanism. Most commercial relationships in commodity-dependent industries operate under multi-month or multi-year forward contracts with prices fixed at the time of contract execution. Airlines hedge jet fuel costs typically 6-18 months forward. Major retailers contract shipping rates 12-24 months forward. Agricultural producers contract fertilizer prices for an entire growing season. Manufacturers source intermediate inputs under quarterly or annual frameworks. Each of these contractual structures defers the effect of current spot-market price changes onto future periods when contracts come up for renewal. The shock to spot prices in February-March 2026 will not reach the contracts being negotiated in 2026 until those contracts expire and are renegotiated against the new pricing environment — typically Q3-Q4 2026 for shorter contracts, 2027 for annual cycles, 2027-2028 for longer-dated arrangements.
The combined effect of these two mechanisms produces what economists call "pass-through lags" — the time between the occurrence of a price shock and its full transmission to consumer price indexes. The academic literature is substantial on this point and the framework can engage it directly.
The most relevant empirical work for current purposes is the 2009 study by Galo Nuño in Energy Economics, which found that direct oil-to-refined-product pass-through occurs relatively quickly — approximately 90% of crude oil price changes pass through to refined product prices within three to five weeks. This is the first layer of pass-through and explains the typical 4-6 week lag between crude oil spikes and gasoline pump price changes.
The more consequential pass-through — from refined products and other primary inputs to the broader basket of consumer goods — operates on substantially longer timelines. A 2024 study by Robert Minton (Federal Reserve) and Brian Wheaton (UCLA) using detailed input-output data found that upstream industries (chemical manufacturing, plastics, primary metals) feel approximately 75% of an oil price shock within six months, while downstream industries (consumer goods manufacturing, retail) take approximately twenty months to feel a similar magnitude of impact. The asymmetry reflects the cumulative nature of cost pass-through as goods move through multiple stages of production.
The Federal Reserve's own modeling, summarized in Charles Schwab's April 2026 inflation analysis, estimates that a permanent 10% increase in crude oil prices adds approximately 0.4 percentage points to headline CPI over the course of one year. Critically, this estimate is for each year — meaning the full cumulative pass-through extends across multiple years rather than completing within twelve months.
Combining these empirical estimates with the current shock: Brent crude is up approximately 60% from pre-conflict levels. If the disruption persists and the price level holds (which the framework's reading suggests is more likely than rapid resolution, for reasons developed below), the cumulative consumer price impact would be approximately 2.4 percentage points added to headline CPI over the propagation window. The propagation window itself is the framework's primary forecast: the impact peaks not in 2026, despite the immediacy of the shock, but in Q1-Q2 2027, with elevated price levels likely persisting through 2028.
The propagation timeline, channel by channel
The framework's empirical reading of how the Hormuz shock will propagate to specific household prices is best understood through a channel-by-channel decomposition. Different categories of goods and services have different transmission mechanics, different buffer structures, and different timelines.
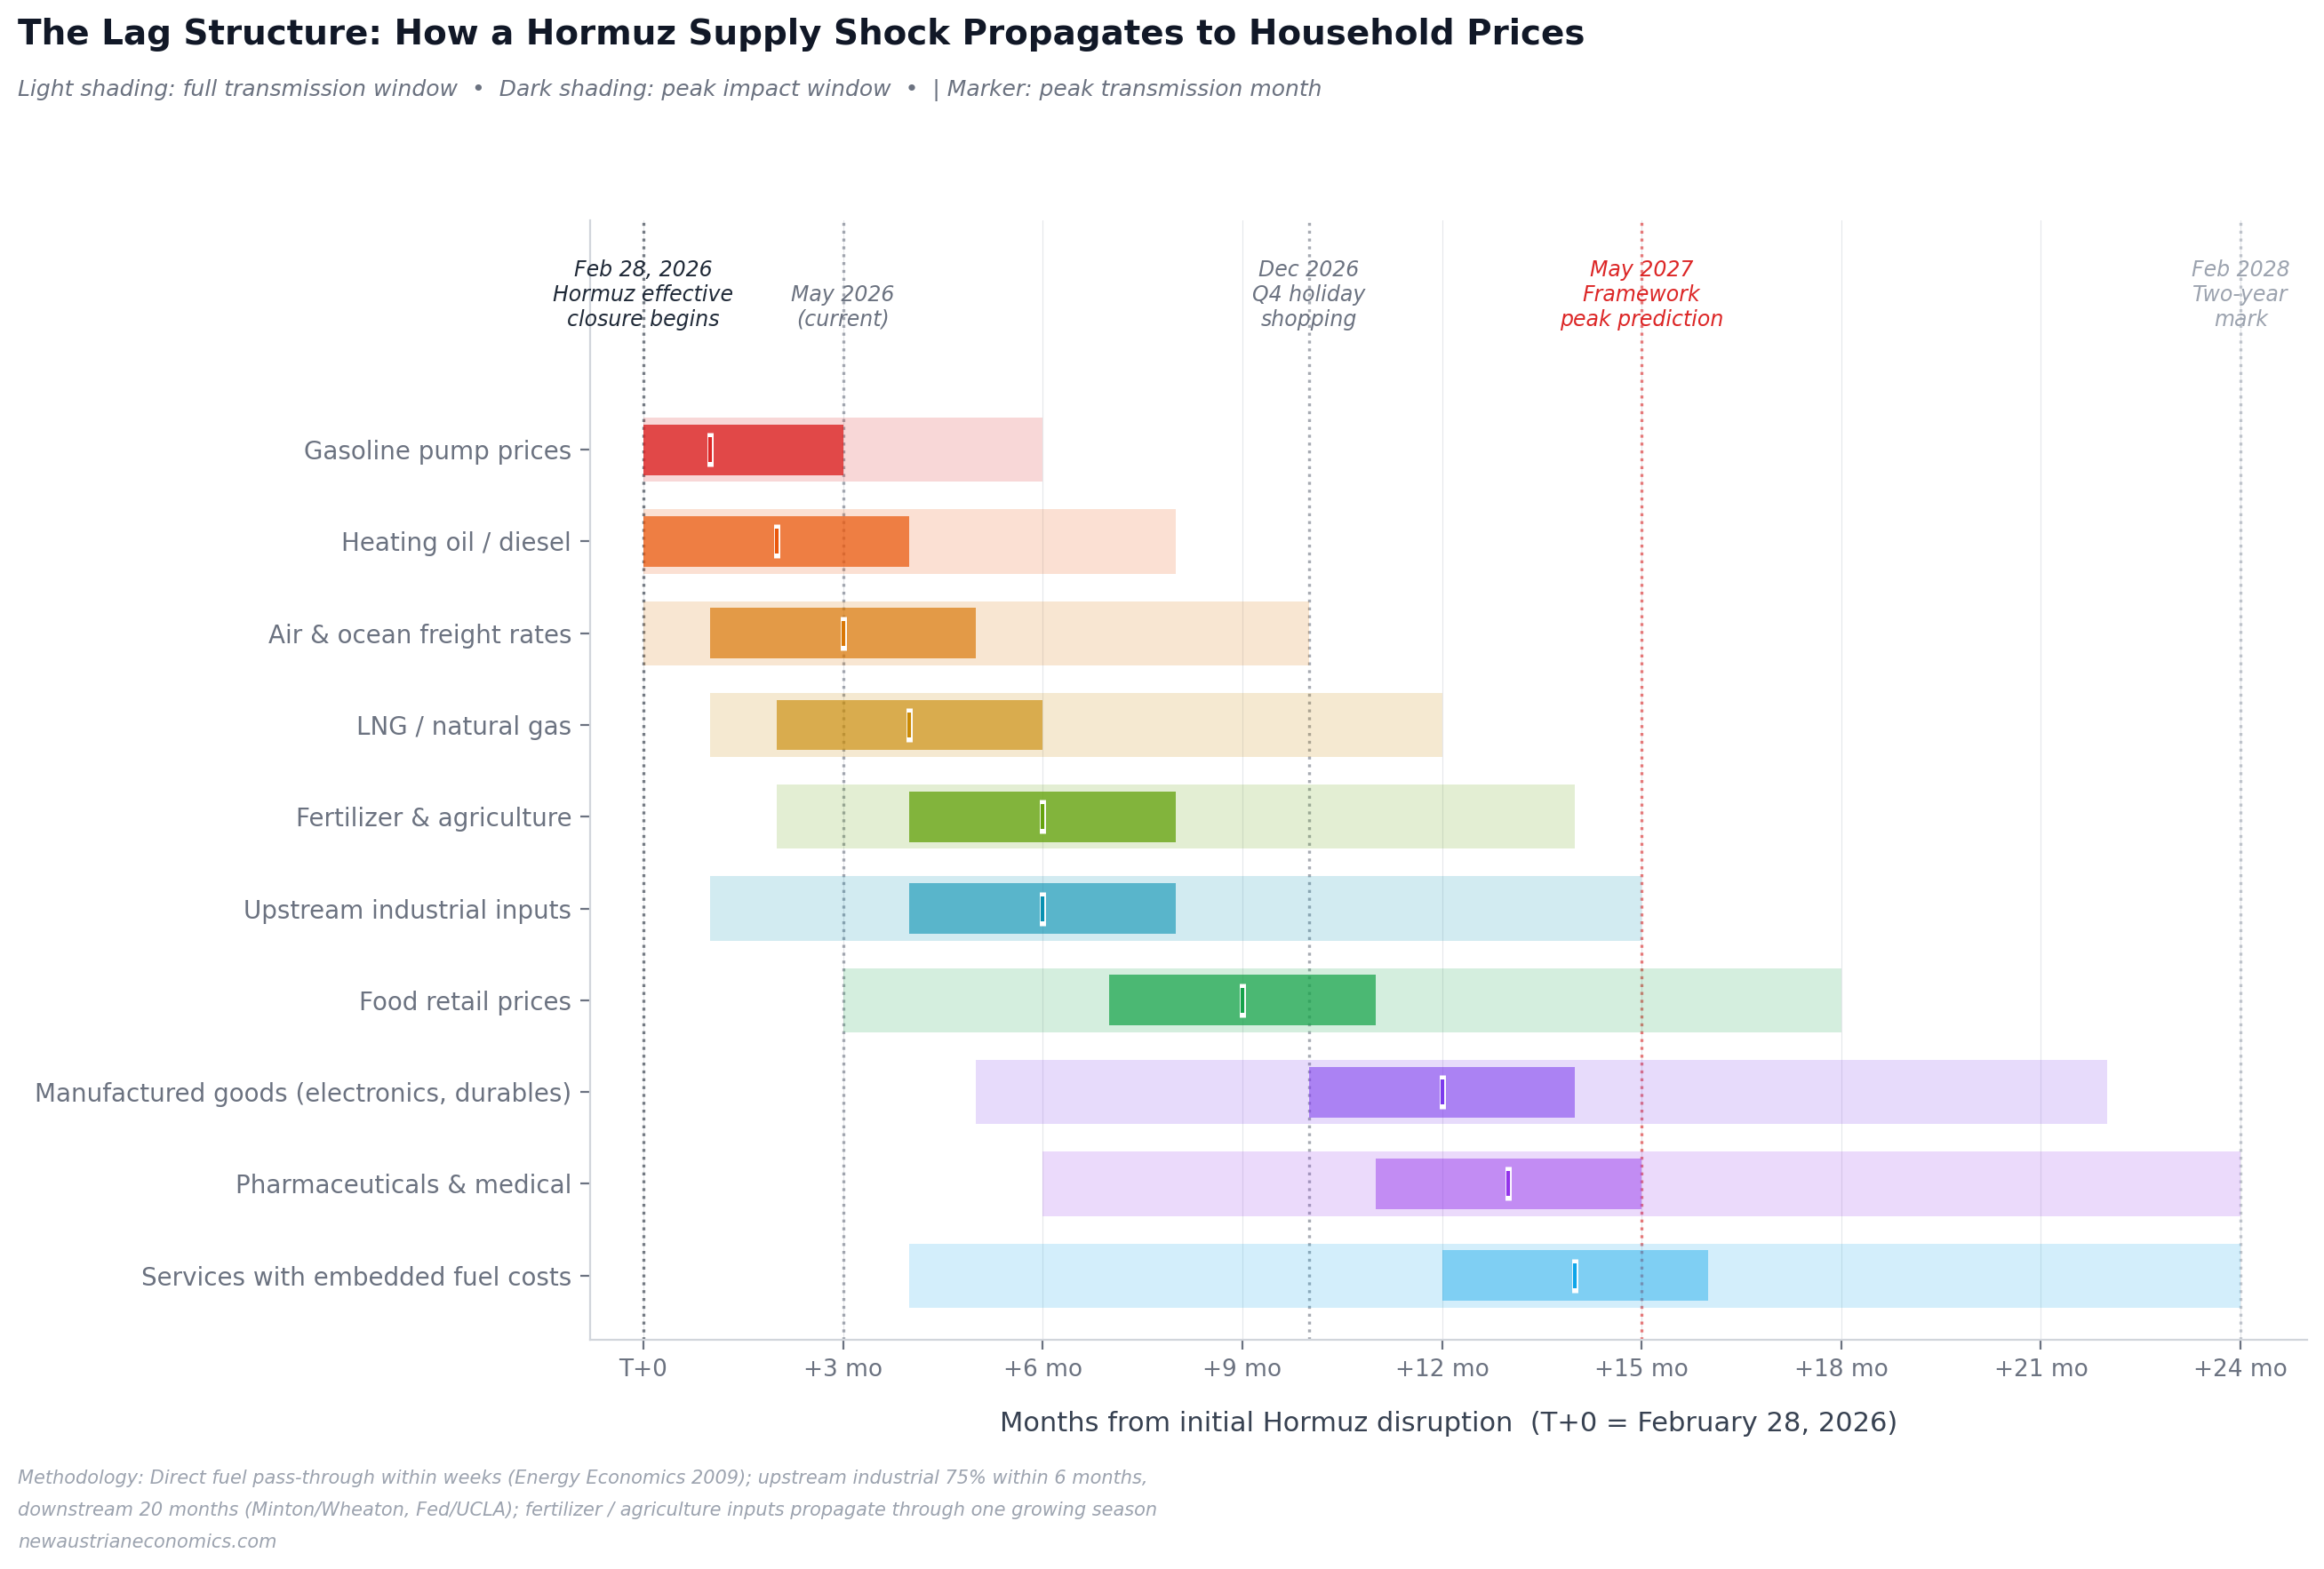
Gasoline pump prices (T+0 to T+6 months, peak ~T+1). The fastest-propagating channel. Refined product pass-through occurs within three to five weeks. American consumers will see meaningful pump-price increases beginning approximately April 2026, with the peak coming approximately May-June 2026. The strategic reserve releases are specifically targeting this channel and are partially succeeding — the disruption has not yet produced the full pump-price response that the crude oil increase would predict in the absence of reserve releases. The framework's reading: pump prices will rise by approximately $1.20-$1.80 per gallon (national average) by mid-2026, with the peak likely persisting into 2027 even after partial geopolitical de-escalation.
Heating oil and diesel (T+0 to T+8 months, peak ~T+2). Similar transmission mechanics to gasoline but with seasonal complications. Diesel prices affect virtually all consumer goods through their role in trucking; heating oil affects approximately 5 million American households (concentrated in the Northeast) who rely on it for primary winter heating. The framework's reading: diesel prices will rise by approximately $1.40-$2.00 per gallon by mid-2026, with the freight-rate transmission effect amplifying the consumer impact in subsequent quarters.
Air and ocean freight rates (T+0 to T+10 months, peak ~T+3). Already moving sharply. Maersk implemented an emergency freight increase on all cargo to and from UAE, Qatar, Saudi Arabia, Bahrain, Kuwait, Iraq, and Oman effective March 2, 2026, with other carriers following within 48 hours. Vessels rerouting around the Cape of Good Hope add approximately 7-14 days of transit time per voyage, with corresponding increases in fuel consumption and operational costs. The freight-rate channel is critical because it amplifies the impact of every other commodity moving in international trade. The framework's reading: container shipping rates from Asia to Europe and to the U.S. East Coast will be elevated by 40-80% through 2026 and likely into 2027.
LNG and natural gas (T+1 to T+12 months, peak ~T+4). Approximately 20% of global LNG transits the Strait of Hormuz. The disruption has produced an immediate spike in LNG spot prices that has propagated through wholesale natural gas markets. U.S. natural gas prices, which had been weak through late 2025 due to abundant domestic production, have risen approximately 35% since the conflict began. The lag here is governed by the contractual structure of LNG supply — most international LNG is sold under long-term contracts with prices linked to oil benchmarks or to specific regional gas indexes, and those contracts adjust gradually. The framework's reading: U.S. natural gas prices will rise approximately 50-80% from pre-conflict levels by late 2026, with effects continuing into electricity prices (where natural gas remains the marginal generation fuel in most U.S. markets) on an additional 6-12 month lag.
Fertilizer and agriculture (T+2 to T+14 months, peak ~T+6). This is the most economically consequential channel and the one the framework reads as most underappreciated in current commentary. Approximately one-third of globally traded fertilizer transits the Strait of Hormuz. Natural gas is the primary feedstock for nitrogen fertilizer production — and natural gas prices are themselves rising through the LNG channel described above. Fertilizer accounts for approximately one-third of the cost of corn and wheat production, per U.S. Department of Agriculture data. The lag here is dominated by the agricultural growing cycle: fertilizer purchased for the 2026 growing season was largely contracted before the disruption began, with effects from the disruption flowing into 2027 plantings, into 2027 harvests, and into 2027-2028 food prices. The framework's reading: U.S. grain prices will rise approximately 25-40% by mid-2027 due to the fertilizer transmission alone, with broader food price impacts following through standard agricultural-to-retail propagation.
Upstream industrial inputs (T+1 to T+15 months, peak ~T+6). The Minton/Wheaton "upstream 75% within 6 months" empirical finding governs this channel. Chemical manufacturing, plastics production, primary metals refining, and similar industries that use oil and natural gas as both feedstock and energy will see significant cost pressure beginning in Q3 2026, with peak transmission in late 2026. The framework's reading: producer price indexes will show meaningful elevation by Q4 2026, with the broader manufacturing sector following on the standard upstream-to-downstream timeline.
Food retail prices (T+3 to T+18 months, peak ~T+9). Food inflation was already running at 2.6% year-over-year in February 2026 (the second-highest rate since mid-2023) before the Hormuz disruption began. The compounding from fertilizer, agriculture, and shipping channels will produce meaningful additional food price pressure beginning in Q4 2026, with peak impact in Q2-Q3 2027. The framework's reading: headline food CPI will rise to approximately 6-9% year-over-year by mid-2027, with specific items (grain-based products, oils, packaged goods with high transportation content) seeing substantially larger increases.
Manufactured goods — electronics, durables (T+5 to T+22 months, peak ~T+12). The Minton/Wheaton "downstream 20 months for similar impact" finding governs this channel. Current retail inventories of electronics, household durables, automotive parts, and similar manufactured goods were produced before the disruption and are pricing into 2026 retail under pre-shock cost structures. Replacement inventory produced in 2026 under elevated input costs will reach retail through 2027. The framework's reading: consumer electronics, appliances, and similar durables will see 5-10% real price increases through 2027, with the timing concentrated in late 2026 (back-to-school, holiday) through mid-2027.
Pharmaceuticals and medical supplies (T+6 to T+24 months, peak ~T+13). Pharmaceutical supply chains are particularly exposed to Hormuz disruption because approximately 40% of active pharmaceutical ingredients are produced in India, with substantial fractions of finished pharmaceutical manufacturing also concentrated in South Asian sourcing that depends on Indian Ocean shipping. Combined with the Red Sea disruption, pharmaceutical supply chains face simultaneous routing pressure. The framework's reading: pharmaceutical prices, already a sustained source of household stress, will see 8-15% nominal increases through 2027, with specific drug categories (generics dependent on Indian API production) potentially seeing substantially larger impacts.
Services with embedded fuel costs (T+4 to T+24 months, peak ~T+14). Airlines, ridesharing, delivery services, and similar fuel-dependent services pass through fuel cost changes on multi-month delays governed by their hedging programs and competitive dynamics. The framework's reading: airfares will see 15-25% increases through 2027; delivery service prices (Amazon, USPS, UPS, FedEx) will see 8-12% increases with broader effects on the cost-of-goods-delivered for online retail.
The buffer math
The framework's specific quantitative forecast depends on what remains in the buffers and how long those buffers can continue to absorb the underlying disruption. The buffer accounting is sobering.
Strategic Petroleum Reserve depletion. The SPR held approximately 638 million barrels when President Biden took office in January 2021. The post-Russia-invasion releases of 2022 drove holdings down to a 40-year low of 347 million barrels by July 2023. Partial refilling through 2024-2025 brought levels to approximately 395 million barrels by early 2025. The March 2026 release of 172 million barrels — the largest single-country release in history, part of the coordinated 400 million barrel IEA release — has brought holdings to approximately 243 million barrels, the lowest level since February 1982.
The maximum capacity of the SPR is approximately 700 million barrels. The reserve is currently at 35% of capacity. Salt cavern structural integrity at the storage sites is reportedly at risk from the repeated drawdown cycles, with congressional appropriations of $218 million for maintenance and $171 million for refilling representing modest progress relative to the depletion trajectory. The Trump administration's stated refill commitment depends on the 172 million barrel release being structured as an exchange with 18-24% premium repayment by participating companies through 2026-2029, which would eventually return approximately 200 million barrels to the reserve if the program executes as planned.
International coordination buffer. IEA member countries collectively hold approximately 1.2 billion barrels of public emergency stocks plus approximately 600 million barrels of industry stocks. The March 11, 2026 coordinated release of 400 million barrels represents approximately 22% of this combined buffer. Sustained drawdown at the rate the Hormuz disruption is producing (effectively replacing 20% of global daily oil supply) would exhaust the combined buffer in approximately 90 days of full coverage, although the practical pattern of partial coverage and rotation could extend the effective buffer to perhaps 6-9 months.
Commercial inventory buffer. Refinery and distribution inventories provide additional weeks of buffer that varies by region and product type. Cushing, Oklahoma — the central U.S. oil storage hub — is reportedly approaching operationally low levels as the Iran war crisis continues. Asian refining centers are operating substantially below normal inventory levels. Container shipping inventory has been substantially exhausted by the rerouting around the Cape of Good Hope.
Hedging buffer. Commercial hedging programs, particularly for airlines, manufacturers, and major commodity users, were structured under pre-conflict price assumptions. These hedges are protecting the affected counterparties through their hedge expirations, with effects concentrated in Q3-Q4 2026 as 2026 hedges roll into 2027 hedge structures at substantially higher strike prices.
The combined buffer picture: the world has perhaps 6-12 months of effective absorptive capacity for the current rate of disruption before the buffers are exhausted to a point where they can no longer mute the underlying price signal. This buffer exhaustion timeline closely matches the propagation timing the channel analysis above produces. The buffers are deferring impact during 2026; the impact arrives in 2027 as the buffers exhaust.
Why the disruption won't resolve cleanly
The framework's forecast depends on a specific reading of the geopolitical situation that differs from the Dallas Federal Reserve's quantitative model. The Dallas Fed analysis from March 2026 produced GDP impact estimates contingent on disruption duration: -0.2 percentage points for one quarter of disruption, -0.3 for two quarters, -1.3 for three quarters. The model implicitly assumes resolution within one to three quarters. The framework reads the situation as structurally unlikely to resolve on that timeline, for four specific reasons.
First, China's incentive structure. China is the largest single importer of Persian Gulf oil and is therefore harmed by the disruption in the immediate sense. China is also a permanent member of the UN Security Council with veto authority over enforcement mechanisms that might end the disruption, and China's broader strategic relationship with Iran (including documented oil purchases at sanctions-discounted prices through informal channels) creates a structural interest in not supporting U.S.-led enforcement measures. The result is paralysis: China loses from the disruption but also loses from supporting its resolution.
Second, Russia's incentive structure. Russia is a major oil exporter whose revenue benefits directly from elevated global oil prices. A prolonged Hormuz disruption that keeps Brent crude above $90/bbl partially offsets the impact of Western sanctions on Russian energy revenue. Russia has no incentive to support enforcement mechanisms that would end the disruption.
Third, Iran's incentive structure. Iran's economic situation pre-conflict was severely constrained by U.S. sanctions. The disruption demonstrates Iranian capability to impose costs on Western economies in a way that conventional military action could not match. The IRGC has incentive to maintain capability for disruption — even if not active disruption itself — as continued leverage in any negotiated resolution. The framework's reading: even if a formal ceasefire is achieved, the threat of recurring disruption will keep insurance markets and shipping operators cautious for an extended period.
Fourth, the insurance market dynamic. War risk insurance was cancelled for Gulf transits on March 5, 2026. Insurance markets re-establish coverage slowly after disruption events because the underwriting requires assessment of forward risk that is structurally difficult to estimate during ongoing tension. The framework's reading: even with formal geopolitical resolution, the insurance market re-establishment will lag by 6-12 months, during which time the shipping disruption will continue at reduced intensity.
The combined effect: the disruption will likely persist at meaningful intensity through the second half of 2026, with partial improvement through 2027 and full normalization not before 2028 at the earliest. This timeline is essentially independent of any specific geopolitical resolution scenarios that may emerge in the interim. The structural conditions that prevent rapid resolution are themselves the framework's central forecasting input.
The framework's specific forecast
Combining the channel propagation analysis, the buffer math, and the geopolitical structural reading produces a specific, time-bounded forecast for U.S. household price impacts. The framework records these predictions for future testing:
Through Q3 2026: Pump prices elevated by $1.20-$1.80 per gallon (national average); headline CPI rising to 4.5-5.5% year-over-year; food inflation accelerating from 2.6% to 4-5%; LNG and natural gas prices elevated 40-60% from pre-conflict levels. The strategic reserve releases continue to mute the impact, particularly at the gasoline pump.
Q4 2026: Reserve buffers approaching exhaustion at the rate of continuing disruption. Manufactured goods beginning to show retail-level price effects as 2026 inventory cycles complete. Holiday shopping season experiencing notable price compression on durables. Headline CPI in the 5-6% range.
Q1-Q2 2027 (peak impact window): Fertilizer and agriculture effects fully transmitting through the 2027 planting cycle. Food prices showing the largest year-over-year increases of the cycle, potentially reaching 6-9%. Headline CPI peaking in the 6-7% range. Real wage growth meaningfully negative as nominal wages lag price increases. The framework's central forecast.
Q3 2027 onward: Partial moderation as buffer rebuilding begins, hedging programs adjust to new price levels, and supply chain participants establish stable operating patterns at elevated cost levels. Headline CPI moderating to 4-5% range and remaining elevated through 2028.
These specific numerical forecasts are estimates with substantial uncertainty bands. The framework's confidence is higher on the timing structure than on the specific magnitude. The peak impact arriving in Q1-Q2 2027 — approximately 12-15 months after the initial disruption — is the framework's strongest claim. The specific magnitude depends on factors (resolution timing, buffer effectiveness, secondary disruption events, monetary policy response) that the framework cannot predict precisely.
What households should take from this
The framework's specific operational observations for household readers:
The aggregate price data will report this on lag. Headline CPI will not reflect the full impact until 9-15 months after the household begins experiencing it through retail purchases. Households who wait for aggregate confirmation before adjusting their planning will be making decisions on data that materially understates current cost pressure. The framework's recommendation: use forward-looking channel-specific signals (gasoline futures, LNG benchmark prices, container shipping indexes) as leading indicators rather than relying on aggregate inflation reports.
The buffer exhaustion timeline is the critical variable. Strategic reserve releases and commercial buffer drawdowns are masking the underlying impact during 2026. As those buffers exhaust through Q4 2026 and into 2027, the full price signal will arrive. Households making major purchase decisions (vehicles, appliances, durables) in 2026 should consider that the same goods will likely be substantially more expensive in 2027 — the inventory cycle is currently working in the household's favor for one-time purchases.
Fertilizer and food are the highest-leverage channels. The fertilizer-to-food propagation through the 2027 planting cycle is the most economically consequential single channel and the hardest to escape through individual household preparation. Households with significant exposure to food inflation (large families, fixed incomes) should anticipate meaningfully tighter household budgets through 2027 and consider whether existing food-spending categories can be reconfigured before the impact arrives.
The strategic petroleum reserve is now near operationally low levels. Households whose financial planning assumed continued availability of reserve releases as a price-stabilization mechanism should recalibrate. The reserve at 243 million barrels (after the March 2026 release) is at its lowest level since February 1982. Any subsequent disruption that arrives before the reserve is rebuilt will face substantially less buffer than what muted the early-stage impact of the Hormuz disruption.
Geographic and consumption-mix exposures vary substantially. The framework's prior metro saleability work (Articles 17, 18, and 19) identified specific regional exposures to housing-related stress; the supply shock adds an additional regional dimension. The Northeast (heating oil dependence), agricultural regions (fertilizer cost exposure), and metros with high gasoline consumption per capita face larger relative impacts than urban metros with shorter commutes and natural gas heating. Household preparation should weight specific consumption patterns rather than assuming uniform national impact.
The closing observation
The framework's broader analytical posture across this catalog has consistently been that the aggregates that the financial press and policy community track are structurally inadequate to capture the timing and distribution of economic stress as it actually arrives at the household level. The QE-to-inflation lag of 2008-2022 was the canonical demonstration of this inadequacy for a monetary shock. The framework's reading is that the Hormuz disruption of 2026 will be the canonical demonstration for a supply shock — and that the basic structural lesson is the same in both cases.
Inflation does not announce itself on the calendar of news cycles. It arrives on the calendar of supply chain mechanics, contract renewals, inventory turnover, hedging program rollovers, and buffer depletion. The current quiet on the inflation-print front, six months into a major supply disruption, is not evidence that the impact will be moderate. It is evidence that the impact is propagating on the standard schedule. The framework's analytical job is to make that schedule visible before the prints catch up.
By the time the May 2027 CPI release confirms what the framework has just predicted, the American household will have been absorbing the impact through their grocery store visits, their pump fillings, their utility bills, their durables purchases, and their service prices for nine to fifteen months. The aggregates will be reporting what households already know. The framework's value is in making the trajectory visible while it can still inform planning.
The lag is the structure. The structure is now activated. The propagation is underway on schedule, regardless of when any specific policymaker or commentator acknowledges it. The next 18-24 months of household financial reality will be substantially determined by mechanisms that began operating on February 28, 2026 and that the framework has now, through this essay, traced channel by channel through the specific empirical literature on pass-through dynamics.
The next installment of Watching the Cracks will engage whichever specific empirical event most demands framework attention as the propagation unfolds. The watching continues. The lag continues. The structural validation of the framework's broader thesis — that monetary architecture in 2026 has accumulated substrate fragility that conventional aggregates cannot capture — continues to compound with each new event added to the catalog's diagnostic record.
This is the tenth installment of "Watching the Cracks." The framework's predictions recorded here for future testing: peak household impact arrives in Q1-Q2 2027, with headline CPI reaching 6-7% in the peak quarter; pump prices elevated $1.20-$1.80 per gallon by mid-2026; food prices showing 6-9% year-over-year increases by mid-2027; fertilizer-driven grain price impacts compounding through the 2027 planting cycle; reserve buffer exhaustion concentrated in Q4 2026 - Q1 2027. The propagation timeline chart above visualizes the empirical pass-through estimates from the academic literature (Energy Economics 2009; Minton/Wheaton Fed/UCLA 2024; Federal Reserve modeling cited in Schwab 2026) applied to the specific February 28, 2026 Hormuz disruption shock.
Related essays
The Saleability Audit of Bitcoin: What Menger Would Say in 2026
Bitcoin maximalists insist Bitcoin is the most saleable monetary good ever created. Skeptics insist it doesn't work for the African villager or the rural Chinese citizen the maximalists invoke. Both positions miss what Menger's framework actually says when applied carefully. The audit produces uncomfortable results in both directions — Bitcoin scores remarkably well on some criteria and remarkably poorly on others — and the actual ground-truth of crypto adoption in emerging markets in 2026 is something neither camp accurately describes.
The Mengerian Stress Index: From Spec to Live Dashboard
Article 3 of this series proposed a quantifiable extension of Menger's saleability spectrum. This essay turns the proposal into a working framework: each of the five marketability proxies is defined precisely, the composite Mengerian Stress Index (MSI) is motivated, and the marketability half-life is operationalized as a regime-classification tool. The specific weights and calibration that drive the live MSI dashboard are deliberately not published; current readings live on the dashboard itself.
AI Compute as Nascent Real Bills: A Clearing Instrument for the Machine Economy
Fekete's most misunderstood idea — the Real Bills Doctrine — described how the 18th-century commercial economy spontaneously developed a short-duration, self-liquidating clearing instrument for goods in transit to the consumer. The 21st-century compute economy is developing the same thing, and no one is calling it what it is.