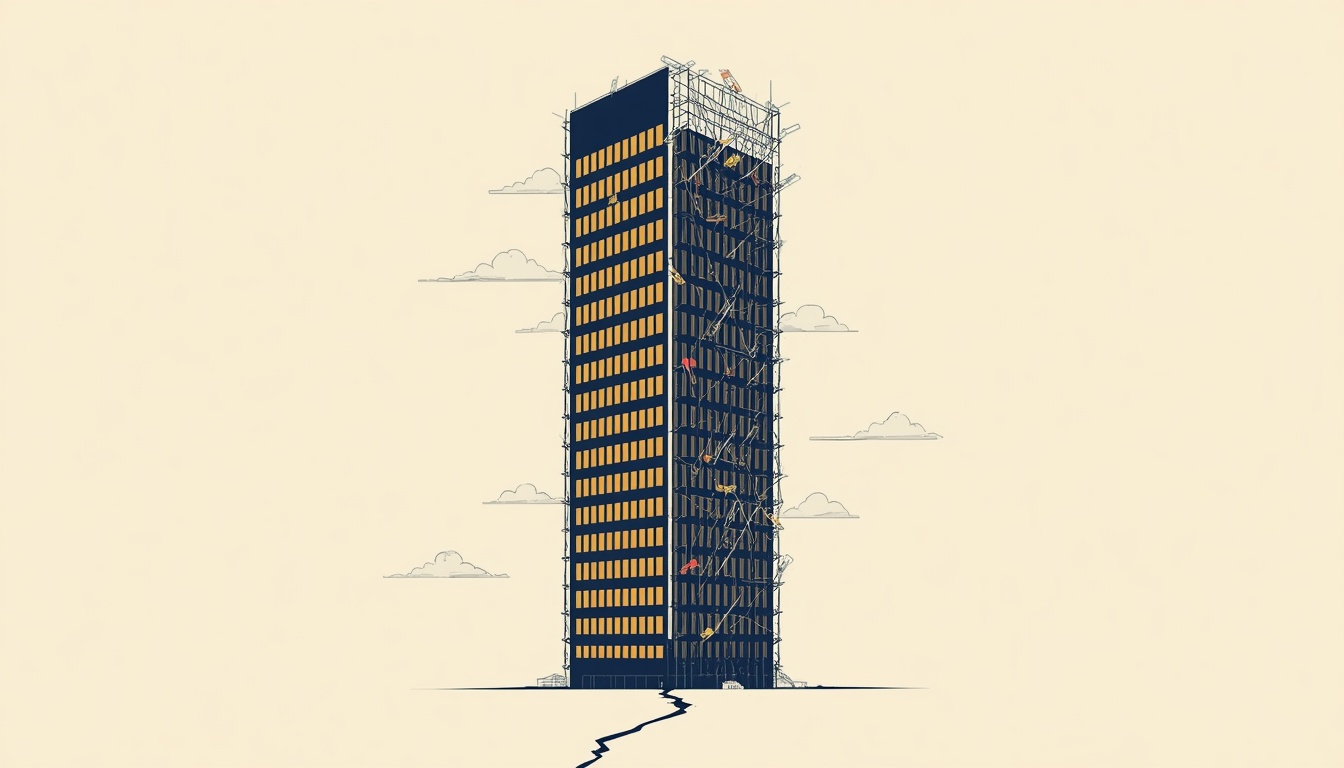
In April 2026, an investor named Marc Calabria purchased a long-vacant eight-story office building at 401 South State Street in Chicago's Loop for $4 million. The building had last traded a decade earlier at $68.1 million. The price decline: 94%. Calabria's stated plan is to convert the building into "an urban farming and food innovation center" — a use case that requires substantial physical reconfiguration of the structure but no longer requires the building to function as the Class B office property it was originally designed to be. Around the same time, an investor named Asher Luzzatto bought a two-building complex in Denver for $5.3 million. The complex had traded at $176 million in 2013. The price decline: 97%. In Washington DC, Hossein Fateh bought the former GSA office building for $24 million — just over $25 per square foot — against a $100 million prior valuation. In San Francisco, an affiliate of CW Capital Asset Management acquired the bottom eight floors of 1155 Market Street at a foreclosure auction for $4 million against a $48 million CMBS loan.
These are not anomalous transactions. They are the visible surface of a much broader pattern that is now operationally arriving in commercial real estate after three years of "extend and pretend" — the term of art for the strategy by which lenders and borrowers cooperated to defer recognition of losses by extending maturing loans and modifying terms rather than forcing default or sale. The strategy worked, in the limited sense that it kept reported delinquency rates lower than the underlying credit quality warranted, while everyone waited for interest rates to fall and for office demand to recover. Interest rates did not fall enough. Office demand did not recover enough. By the start of 2026, the strategy was no longer viable for an increasing share of the affected loans, and the cascade now visible in the data is the institutional manifestation of that exhaustion.
This essay is the eleventh installment of Watching the Cracks. It does three things. First, it documents the specific empirical events of 2026 that demonstrate the cascade is operationally here — named properties, specific transactions, specific loan modifications. Second, it engages "extend and pretend" as a structural mechanism by showing how the practice produces directly observable distortions in the published CMBS delinquency time series. Third, it locates the cascade's downstream risk in the regional banking sector, which holds approximately 70% of U.S. CRE loans against approximately 5% held by the largest banks — a concentration that means the eventual recognition of losses will flow primarily through the institutions least equipped to absorb them. The framework's broader catalog has been making this argument since Article 16 (FDIC banking diagnostics) and Article 19 (the tax-plus-insurance wedge applied to housing). The 2026 data validates the prediction trajectory with the kind of specific empirical detail that has, throughout this catalog, distinguished the framework's analytical posture from the conventional discussion.
A note on framing before proceeding. The CRE cascade is now widely discussed in financial press. The data this essay engages is publicly available. What the framework adds is the structural reading: the connection between the visible transactions and the underlying substrate-fragility thesis the catalog has been developing across twenty-six prior essays. Reporters cover the fire sales; analysts cover the delinquency rates; what neither tends to do is connect both to the broader monetary-architectural pattern the framework has been documenting. That connection is the analytical work this essay does.
The two-mode market
The 2026 commercial office market is clearing in two operationally distinct modes simultaneously, and the distinction matters for understanding what is happening structurally.
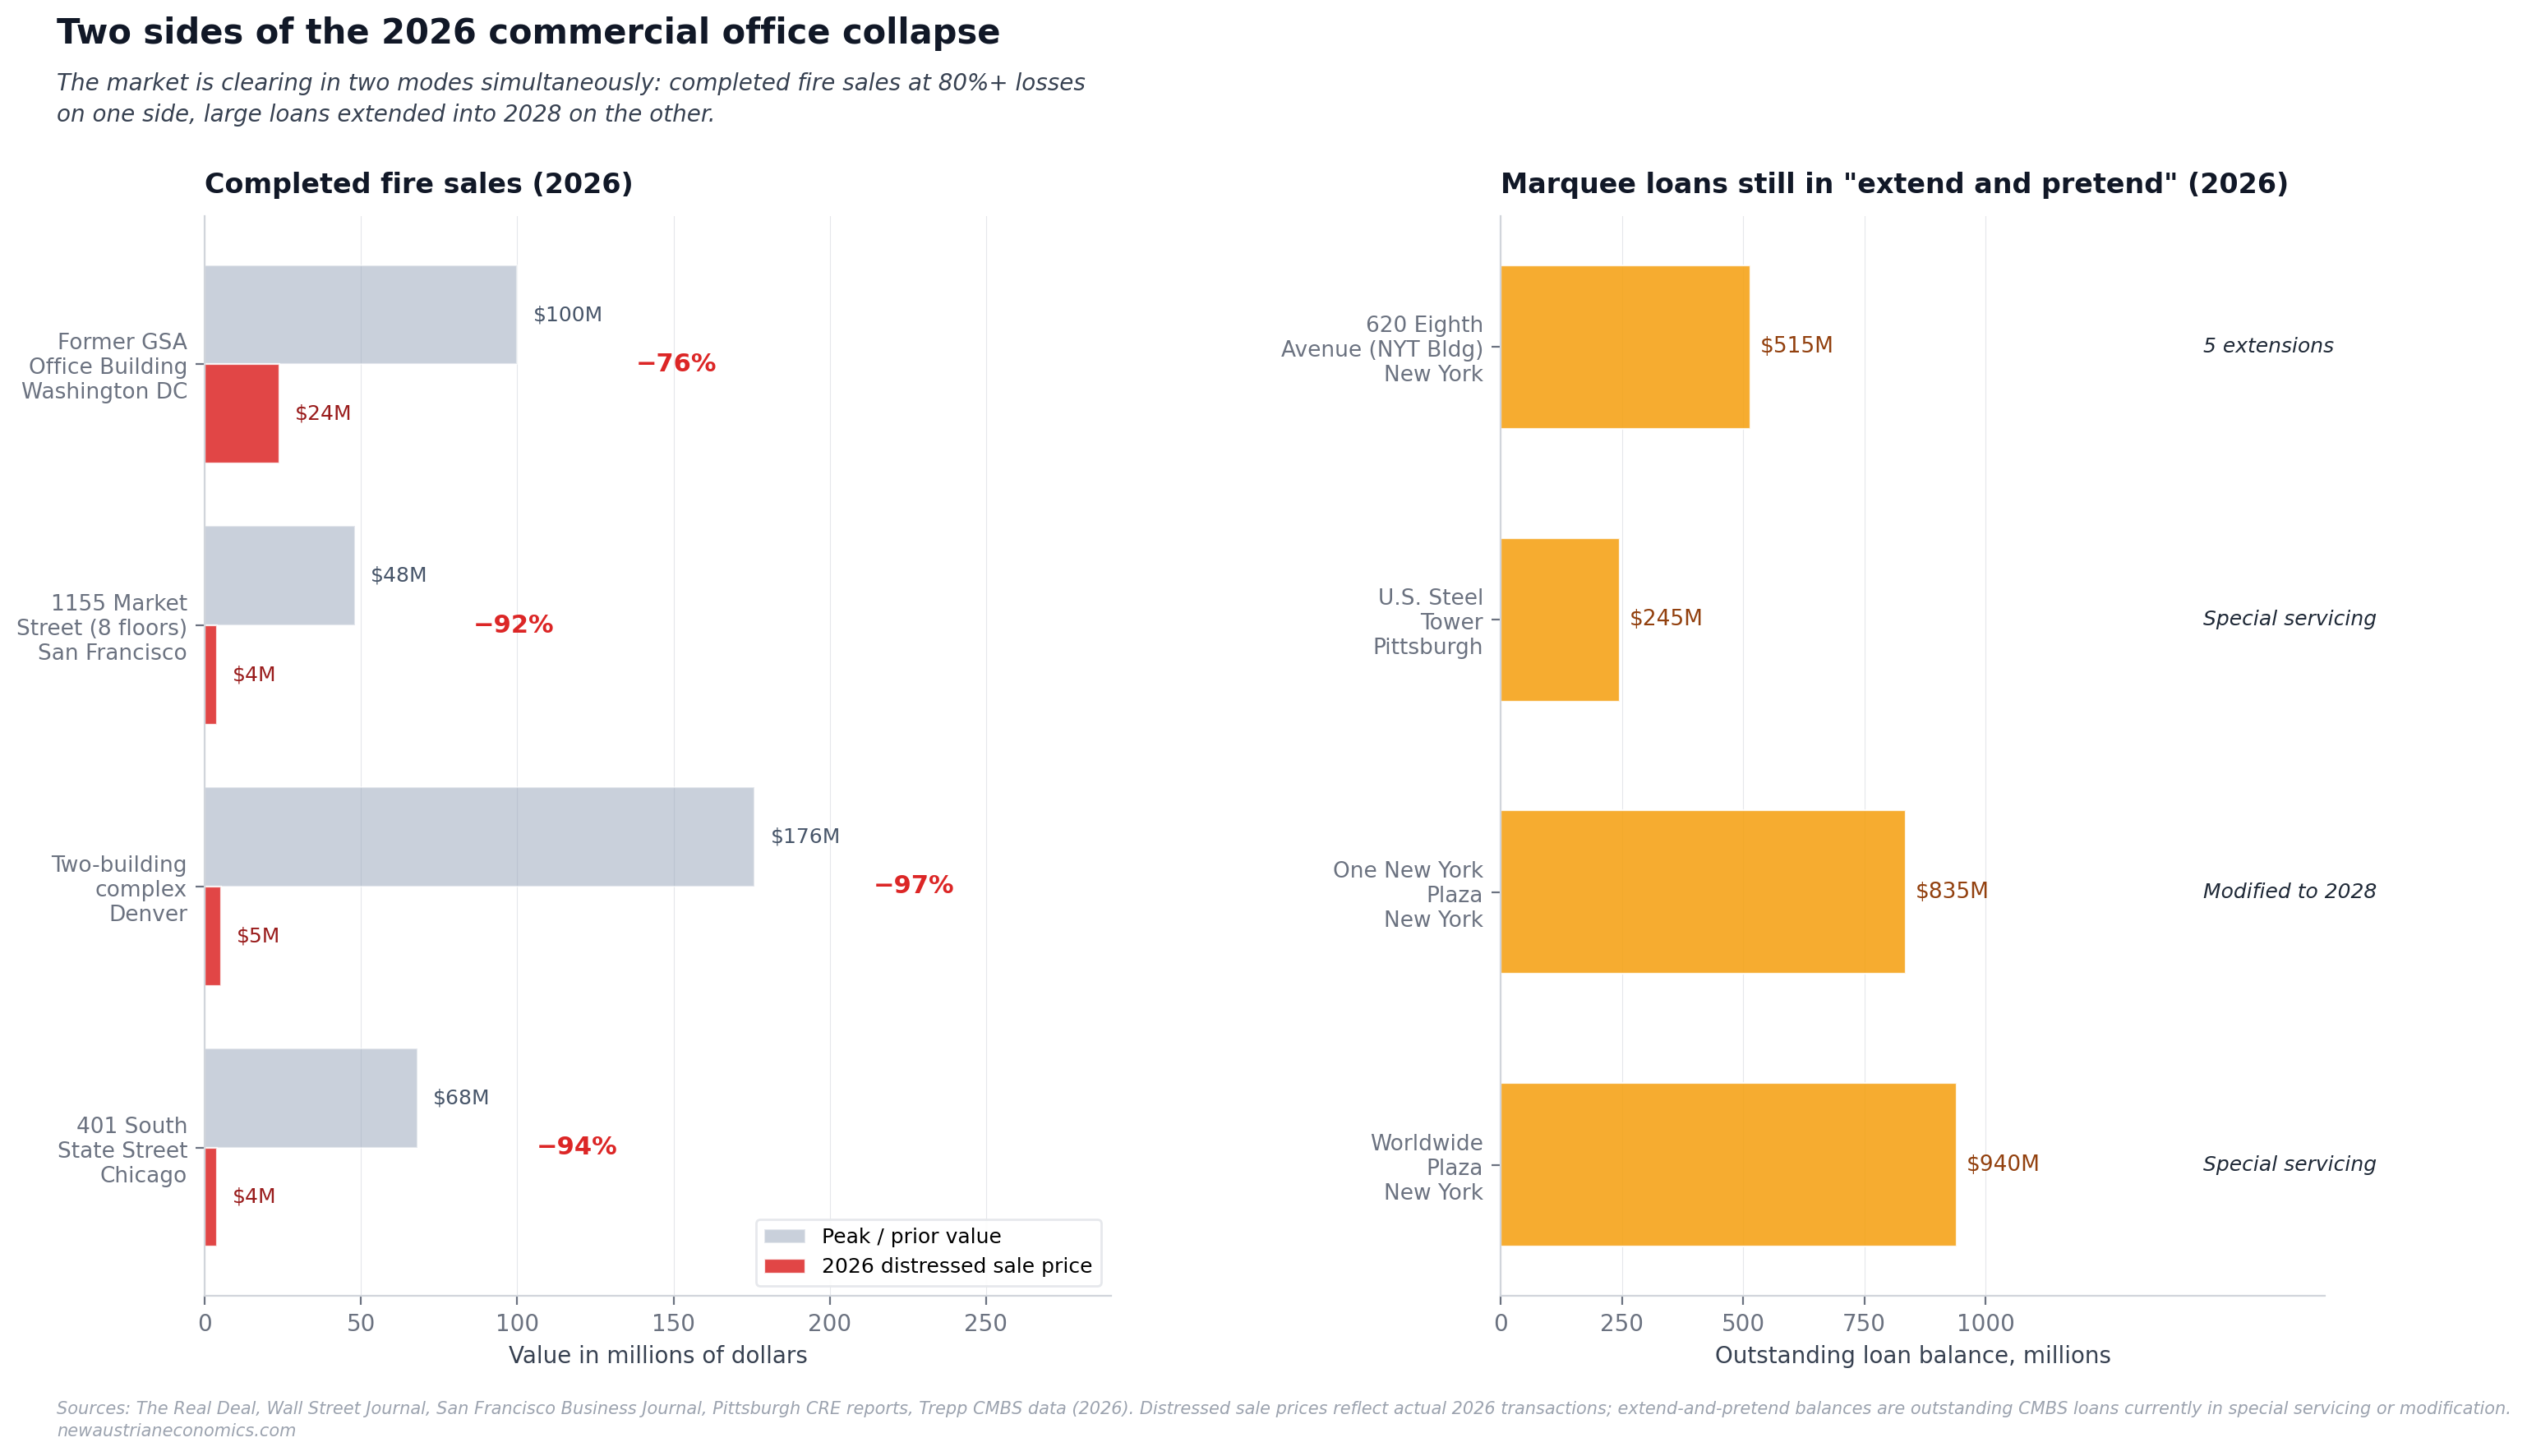
Mode one is forced clearing. Properties whose lenders have lost patience with the extend-and-pretend strategy, or whose ownership structures cannot survive further deferral, are being sold at prices that reflect the underlying credit quality of the asset rather than the carrying value on lender balance sheets. The 401 South State Street transaction in Chicago is canonical: $68.1 million prior value, $4 million 2026 sale price, 94% loss. The Denver two-building complex: $176 million prior value, $5.3 million 2026 sale price, 97% loss. The San Francisco 1155 Market floors: $48 million CMBS loan, $4 million foreclosure auction, 92% loss. The former GSA building in Washington DC: $100 million prior value, $24 million sale, 76% loss. There were more than 200 distressed office sales in 2025, up from 133 in 2023; through January and February 2026 alone, the pace was accelerating further.
What distinguishes mode-one transactions is that the buyers do not plan to operate the buildings in their original use. Calabria's "urban farming and food innovation center" is not an unusual concept; it is the typical structure of the mode-one transaction. The buyer is acquiring the physical structure at a price that allows them to absorb the cost of converting it to a use that the current market actually wants — typically residential conversion where regulations permit, light industrial or maker-space use where the building's structural characteristics support it, or specialty uses (urban agriculture, medical, education) where the location provides an advantage. The framework's reading: mode-one transactions are the saleability discovery process operating without the substitute layer of lender forbearance. The buyer pays what the asset is worth in its physically-deliverable form, not what the prior monetary regime's pricing infrastructure said it was worth.
Mode two is continued deferral. The marquee loans, the ones whose magnitudes are large enough that institutional considerations dominate the disposition decision, remain in extend-and-pretend status. Worldwide Plaza in Manhattan ($940 million loan) was sent to special servicing in early 2026 but has not been resolved through sale. One New York Plaza ($835 million) was modified and extended to January 2028 — kicked nearly two full years down the road. The U.S. Steel Tower in Pittsburgh ($245 million) was sent to special servicing in March 2026 but has not been forced into sale. Most notably, 620 Eighth Avenue — the former New York Times Building, whose upper portion carries a $515 million mortgage — has been extended five times since 2020 by the borrower (Brookfield) and special servicer working in coordination. Each extension is technically legal under the loan documentation. Each extension is also a deferral of the same loss-recognition event that the mode-one transactions are now executing.
The framework's central observation: these two modes are operating on the same underlying asset class, in the same economic environment, often in the same metropolitan areas, with the disposition outcomes determined primarily by the size of the loan and the institutional considerations of the lenders involved. Smaller loans on Class B properties owned by relatively smaller borrowers get marked to market and sold at 90%+ losses. Larger loans on marquee properties owned by relatively larger borrowers get modified, extended, and held at carrying values that bear no relationship to the prices the same buildings would fetch in a sale. This is not market efficiency. This is institutional dispensation operating to protect specific balance sheet positions while the broader market clears around the protected loans.
The data itself shows the mechanism
What makes the 2026 CRE situation analytically unusual is that the extend-and-pretend mechanism is directly observable in the published CMBS delinquency time series. The framework rarely gets to point at a single data series and say "the manipulation is happening in this number, you can see it" — but in this case the structure of the data is itself the evidence.
In January 2026, the Trepp CMBS overall delinquency rate hit 7.47%, with office delinquency at 12.34% — an all-time high. In February 2026, the overall rate dropped 33 basis points to 7.14%, and office delinquency fell 114 basis points to 11.20%. The decline was not the result of borrower performance improving. It was the result, per Trepp's own reporting, of "the execution of modifications and extensions of five large, matured office loans and four large mall loans," with office extensions ranging from "one month to almost three years." In March 2026, the overall rate increased 41 basis points to 7.55% as the same pattern continued — newly delinquent loans pushing the rate back up, while modifications and extensions pulled it back down. Trepp's analysts described the dynamic explicitly: "a sideways delinquency trend as loans mature, go delinquent, cure, and become delinquent again." Roughly 40% of the newly delinquent loans in February were classified as "performing matured balloon" the prior month — meaning loans that had reached maturity, been extended in some technical form to remain classified as performing, then crossed back into delinquency when the extension proved insufficient.
The framework reads this pattern carefully. The published delinquency rate is not a measure of how many loans are in genuine distress. It is a measure of how many loans are in distress that the special servicers have chosen not to modify within the reporting period. The same loan can cycle in and out of "delinquent" status multiple times across consecutive months as modifications are executed, then fail, then be re-modified, then fail again. The 12.34% January office delinquency reading and the 11.20% February reading do not represent improving credit conditions; they represent the same underlying pool of distressed loans being processed through different administrative classifications at different reporting dates.
The implication: the published delinquency rate substantially understates the actual credit stress in the CMBS office sector. Research from Wharton's Hinzen and colleagues (2025), examining bank CRE portfolios specifically, found that "reported delinquencies understate risks from undercollateralized loans by a factor of four" — the formal academic confirmation of what the time series oscillations make visible at the surface. Apply the Hinzen multiplier to the published 11.20% February office CMBS delinquency rate and the implied "true" credit stress reading is in the 40-45% range. That is the rough magnitude of the office sector's underlying problem, masked by the modification machinery.
The named properties and what they tell us
The named distressed properties of 2026 are worth examining individually because each one contains structural information about the broader pattern.
Worldwide Plaza (49th Street, Manhattan). The $940 million CMBS loan went to special servicing in early 2026. The building is approximately 1.6 million square feet of Class A office space anchored historically by major tenants including Cravath, Swaine & Moore (the law firm). The framework's reading: this is a marquee Manhattan address with high-quality tenants — exactly the kind of asset that the recovery thesis ("Class A will be fine, only Class B is in trouble") said would not require special servicing. Its appearance in distress is empirical evidence that the recovery thesis is structurally incomplete.
One New York Plaza (Whitehall Street, Manhattan). The $835 million CMBS loan was modified and extended to January 2028. The building is approximately 2.6 million square feet of Class A space in Lower Manhattan with major tenants including Fried Frank and Morgan Stanley. The 2028 extension is the canonical mode-two transaction: kick the disposition decision two years forward into an environment that is hoped to be more favorable. The framework's prediction: the 2028 extension will not resolve the underlying credit problem, and the loan will either require further extension at that point or be sold under conditions that produce substantial losses for the lender. The extend-and-pretend timeline has shifted from "wait two years for the market to improve" to "wait another two years."
620 Eighth Avenue (former New York Times Building). The $515 million mortgage on the upper portion of the 52-story tower has been extended five times since 2020. The Times itself sold the upper floors to Brookfield in 2007 for approximately $525 million; the original financing was substantially refinanced over the years; each extension since 2020 has been a different exercise in deferral. The framework's reading: a five-extension property is, structurally, a property the lender does not believe can be sold without producing a meaningful loss. The continued extension is the lender admitting the structural reality while declining to recognize it in their financial statements. This is the specific operational form of capital erosion that the framework's broader Fekete-derived analysis has been identifying across multiple sectors.
U.S. Steel Tower (Pittsburgh). The $245 million CMBS loan was sent to special servicing in March 2026. The building is the tallest in Pittsburgh, anchored historically by U.S. Steel itself and including major tenants from the regional professional services sector. Pittsburgh is not New York or San Francisco; the regional CRE markets in second-tier metros face structurally different dynamics, with shallower tenant pools and longer recovery timelines. The framework's reading: the appearance of the U.S. Steel Tower in special servicing is consistent with the catalog's Article 17 metro saleability analysis — second-tier metros face different stress timelines but ultimately face the same structural problem, with the institutional substitute layer (special servicing, modification, extension) operating identically across geographies.
Brookfield DTLA portfolio. Brookfield and its lenders are working to offload four office buildings totaling 4.9 million square feet in downtown Los Angeles — approximately 18% of the entire Financial District's office inventory. The framework's reading: when a single institutional owner is exiting 18% of a metro's downtown office inventory, the metro's office market is not in cyclical adjustment; it is undergoing structural reconfiguration. The buyers of these buildings will either be conversion specialists (residential, mixed-use) or will be opportunistic capital pools willing to operate at substantially reduced rents that reflect the actual demand environment rather than the pre-2020 pricing infrastructure.
The regional banking concentration
The most consequential framework observation about the CRE cascade concerns where the losses will eventually flow. The 2026 fire sales are clearing through CMBS structures, where institutional investors (pension funds, insurance companies, opportunistic credit funds) bear the losses through the securitization mechanisms. But CMBS represents only one part of the broader CRE financing picture, and the larger part is held directly by banks.
The Federal Reserve's published data shows that small and mid-sized banks (those with less than $250 billion in assets) hold approximately 70% of all outstanding U.S. CRE loans. The largest banks (those with more than $250 billion in assets) hold approximately 5% of CRE loans as a percentage of their own balance sheets, while regional banks ($1 billion to $10 billion in assets) hold an average of approximately 35% of their total assets in CRE loans. Federal banking regulators flag CRE-to-equity ratios above 300% as excessive and warranting heightened supervisory attention; many regional banks operate at or above this threshold.
The framework's reading: the eventual recognition of CRE losses will flow primarily through the regional banking sector, which is structurally less equipped to absorb the losses than the larger institutions that dominate financial press coverage. The Hinzen Wharton research is explicit about this: the regional banks are "already lowering lending standards to roll over distressed loans" — meaning they are extending CRE loans on increasingly aggressive terms to avoid the recognition events that would impair their capital positions. This is the same extend-and-pretend dynamic visible in the CMBS data, but operating at the bank level where the consequences flow to depositors (FDIC-insured up to $250,000) and to bank holding company shareholders.
The catalog's Article 16 (FDIC banking diagnostics) made specific predictions about the Q1 2026 Quarterly Banking Profile: problem bank list at 62-66 banks, unrealized losses in the $310-340 billion range, CRE delinquency at or above 1.58%. The Q1 2026 release from the FDIC, published May 19, 2026, showed CRE delinquency at the top 100 banks at 1.78% — within the predicted band on the upper end. The problem bank list was reported at 64 institutions — squarely within the predicted band. Unrealized losses at the larger banks were reported at $324 billion — also within the band. The framework's Article 16 predictions held within the predicted ranges, which is what the framework's intellectual discipline requires: making time-bounded testable claims and engaging the results honestly when they arrive.
But the predicted ranges themselves were calibrated to the substrate-fragility thesis, not to a recovery thesis. The fact that the data has come in within the predicted ranges does not mean the situation is contained. It means the framework's structural reading is operating with appropriate precision. The next several quarters of Quarterly Banking Profile data will continue to test the catalog's predictions, and the framework's posture remains what it has been throughout: descriptive of the structural conditions, attentive to the specific data series that reflect them, and honest about which predictions hold versus which require revision.
The urban doom loop and the fiscal dimension
The CRE collapse has fiscal consequences that extend well beyond the affected lenders and property owners. Major U.S. cities depend substantially on commercial property tax revenue to fund municipal services — police, schools, transit, infrastructure maintenance. A 2026 study from NYU Stern School of Business projects what the researchers call an "urban doom loop": falling office property tax assessments produce lower municipal revenue, which forces service cuts, which reduce urban quality of life, which accelerate the migration of residents and businesses to alternatives, which further depresses property values, which further reduces tax revenue.
The mechanism is already operational. Distressed CRE owners are increasingly filing tax assessment appeals demanding that their tax bills be lowered to match their now-impaired property values. The 401 South State Street building in Chicago, sold at $4 million in 2026, was previously assessed at a value substantially higher than its sale price; the new owner has standing to appeal the assessment downward, which they will. Cities will resist the assessment reductions because their budgets depend on the higher values; but the legal precedent for valuation-following-market-price is well-established, and the eventual resolution will produce meaningful municipal revenue losses across multiple major U.S. cities.
The framework's broader catalog has engaged this dimension through the housing analysis (Articles 17-19, particularly the tax-plus-insurance wedge work). The fiscal dimension of the CRE collapse extends the same pattern to the commercial side: the property tax assessment regime, which has historically functioned as a relatively stable revenue source for municipal governments, is now subject to revaluation pressure from both directions (commercial buildings demanding lower assessments based on sale prices; residential homeowners in stressed metros demanding the same). The framework's prediction: major U.S. cities will face budget deficits and potential credit rating downgrades through 2026-2027 as the assessment revaluations work through municipal balance sheets. Boston, New York, San Francisco, Chicago, and Los Angeles are particularly exposed because of their high prior reliance on commercial property tax revenue.
What this means for the broader monetary architecture
The framework's broader thesis throughout this catalog has been that monetary architecture in 2026 has accumulated substrate fragility visible across multiple disparate sectors when subjected to specific empirical tests. The CRE collapse is the latest sector to produce visible empirical validation, and it deserves explicit connection to the broader pattern.
The substrate that supported the post-2008 CRE expansion was the combination of low interest rates (Federal Reserve policy from 2008 through 2022) and the institutional infrastructure that translated low rates into broadly available CRE financing (CMBS securitization, regional bank lending, life insurance company allocations, commercial bank participations). When interest rates rose sharply through 2022-2024, the underlying property values supported by the prior low-rate environment became structurally inconsistent with the new financing environment. The institutional infrastructure responded by deferring recognition — extend-and-pretend — rather than forcing immediate revaluation. The deferral worked for three years. It is no longer working in 2026.
This is structurally analogous to what the catalog has documented in other sectors:
- Banking (Article 16): the FDIC failure count masking substantial underlying stress through similar deferral mechanisms
- Housing (Articles 17-19): the metro-level saleability heterogeneity hidden by national aggregates, with the tax-plus-insurance wedge breaking household budgets in specific geographies
- Precious metals (Article 24): paper-physical decoupling under stress, with the January 30 silver crash demonstrating the substrate failure operationally
- Cryptocurrency (Article 25): the Iran seizures demonstrating the substitute-layer enforcement reach extending into ostensibly decentralized instruments
- Supply chains (Article 26): the Hormuz disruption propagating through buffer-depleted reserves on calendar-time mechanics
The CRE collapse fits this pattern precisely. The substrate that supported the prior pricing structure has failed. The institutional substitute layer (extend-and-pretend, special servicing, modification) has deferred but not prevented the recognition. The cascade is now operationally visible in specific named transactions and specific bank exposure concentrations. The framework's reading: the cumulative weight of substrate-fragility evidence across sectors is now substantial enough that the broader thesis no longer requires defense; it requires only continued application as additional sectors produce additional empirical validation.
What households should take from this
The framework's specific operational observations for household readers:
Regional bank exposure deserves direct examination. Households with substantial deposits at regional banks ($1 billion to $50 billion in total assets) should examine the specific bank's CRE concentration. The data is publicly available through the Federal Financial Institutions Examination Council's Call Report system. CRE-to-equity ratios above 300% are flagged by federal regulators as excessive. Banks with such concentrations are not immediately at risk of failure — they are, however, structurally exposed in ways that the framework's reading suggests will produce meaningful capital pressure over the next 18-36 months. FDIC insurance covers deposits up to $250,000 per depositor per insured bank per ownership category; households whose deposits exceed the insurance threshold should consider distributing across institutions.
Municipal credit exposure matters for fixed-income holdings. Households holding municipal bonds from major cities with high commercial property tax dependence (Boston, New York, San Francisco, Chicago, Los Angeles) should review the specific issuers' revenue diversification and rainy-day fund positions. The urban doom loop is a multi-year process, not a single event; meaningful credit deterioration is likely over the next 24-36 months in the most exposed municipalities. The framework does not advise specific allocation decisions, but the structural exposure is worth understanding before it becomes news rather than analysis.
REIT exposure may be re-pricing for some time. Publicly traded office REITs have substantially repriced over the past several years, but the framework's reading is that the repricing has not fully absorbed the extend-and-pretend distortions visible in the underlying CMBS data. Households with REIT exposure through retirement accounts or general portfolios should understand that the office sub-sector specifically faces continued downside as the substitute-layer mechanisms exhaust further. Other CRE sub-sectors (industrial, multifamily, data centers) are operating under different supply-demand conditions and should not be evaluated as a single class with office.
The framework's broader case for taking substrate-fragility seriously continues to strengthen. The CRE collapse is the latest sector to produce visible empirical validation of the catalog's structural thesis. Households making long-term financial decisions should price the cumulative weight of the evidence accordingly. The framework's standard guidance — physical assets with direct saleability, geographic diversification of exposure, attention to specific institutional concentrations, awareness of where in the financial architecture's asymmetric support structure the household sits — continues to apply.
The closing observation
In 1958, the economist Hyman Minsky began developing what would later be called the Financial Instability Hypothesis: the observation that periods of economic stability systematically incentivize the accumulation of financial fragility, until the cumulative fragility exceeds the system's absorptive capacity and produces what Minsky called a "Minsky moment" — the sudden recognition that asset prices that had been sustained by leverage and short-term financing arrangements were not actually justified by underlying cash flows. The post-2008 monetary architecture was, in Minsky's vocabulary, designed to produce exactly the conditions he warned about: extended periods of low interest rates that incentivized leveraged accumulation, institutional substitute layers (the Federal Reserve's balance sheet, agency MBS, central bank standing facilities) that allowed the accumulated leverage to operate longer than market conditions would have permitted, and a regulatory framework that discouraged forced recognition of losses in favor of extended workout periods.
The CRE collapse is, in framework terms, the slow-motion Minsky moment in commercial real estate specifically. The accumulated fragility was real. The recognition is no longer fully deferrable. The transactions clearing at 76-97% losses from prior values are the market discovering what the buildings are actually worth under current financing conditions and current demand conditions. The marquee loans still in extend-and-pretend are the institutions buying time for the eventual recognition events. The regional banks holding 70% of the broader CRE exposure are the substrate that will absorb the losses when the recognition events arrive.
None of this required a single sudden crisis to produce. It required only that the accumulated substrate fragility eventually exceed the system's absorptive capacity through the slow grind of expired extensions, exhausted patience, and individual properties whose specific economics made further deferral impossible. The transactions of 2026 are the visible early phase of that process. The framework's prediction is that 2026-2028 will see continued recognition across the CRE sector, with the cumulative magnitude of recognized losses ultimately approaching the Hinzen-implied "true" credit stress reading rather than the lower published delinquency figures.
The next installment of Watching the Cracks — provisionally Article 28 — will engage the May 2026 CPI release that drops Tuesday, June 10, two days from this essay's publication. The framework's Article 26 made specific predictions about the Hormuz supply shock propagation timeline. The May print is the first major data point that should reflect meaningful Hormuz transmission per the framework's calendar mechanics. Whatever it shows — confirming the framework's prediction trajectory or surprising it — will be engaged honestly. The pattern of substrate-fragility validation continues to accumulate across sectors. The framework's posture continues to be what it has been throughout this catalog: descriptive of structural conditions, attentive to specific empirical signals, and honest about what the cumulative evidence reveals.
The collapse is here. The watching continues.
This is the eleventh installment of "Watching the Cracks." The framework's predictions recorded here for future testing: 2026-2028 will see continued CRE loss recognition with cumulative magnitudes approaching the Hinzen-implied "true" credit stress reading (40-45% on office) rather than the lower published delinquency figures; regional banks with CRE/equity ratios above 300% will face meaningful capital pressure through this window; major U.S. cities with high commercial property tax dependence will face budget deficits and potential credit rating downgrades through 2026-2027; the 620 Eighth Avenue / 1 NY Plaza class of extend-and-pretend loans will require further extension or produce substantial loss recognition events when their current modifications expire. The fire-sale chart at the top of this essay shows actual 2026 transactions on the left and outstanding loan balances in extend-and-pretend status on the right; sources include The Real Deal, Wall Street Journal, San Francisco Business Journal, Trepp CMBS data, and the FDIC Q1 2026 Quarterly Banking Profile.
Related essays
The Saleability Audit of Bitcoin: What Menger Would Say in 2026
Bitcoin maximalists insist Bitcoin is the most saleable monetary good ever created. Skeptics insist it doesn't work for the African villager or the rural Chinese citizen the maximalists invoke. Both positions miss what Menger's framework actually says when applied carefully. The audit produces uncomfortable results in both directions — Bitcoin scores remarkably well on some criteria and remarkably poorly on others — and the actual ground-truth of crypto adoption in emerging markets in 2026 is something neither camp accurately describes.
The Decay Function of Marketability: Toward a Computable Menger-Fekete Framework
Menger argued that saleability is a spectrum; Fekete developed the gold basis to measure it for one commodity. This essay proposes a generalizable decay function of marketability, measurable across every modern financial instrument, that renders Menger's core insight computable for the first time.
The Paper Substitute: Agency Mortgage-Backed Securities and the Next Saleability Crisis
Fannie Mae and Freddie Mac issue $9 trillion in paper claims on an asset class — single-family housing — that has the worst saleability characteristics of any major investment available to American households. This is precisely the structure Fekete identified as the most fragile in any monetary system: a deep, liquid market in paper substitutes for an underlying that cannot itself be substituted. The 2008 collapse was the first observable failure of this architecture. The next will be larger.