
Researched and drafted with AI assistance · reviewed and edited by Jason D. Keys
Listen
The Derivative Arrived First: SpaceX, the Inverted Pyramid, and What the Market Actually Watches
Read in Jason D. Keys' synthesized voice
Narrated in the author’s synthesized voice, generated with AI from a recording of his own. The words are his; the delivery is machine-rendered.
Download (22.4 MB)A note before beginning. This essay examines a specific publicly traded security as a case study in market structure. The framework holds no position in SPCX or in any of the exchange-traded products discussed, makes no recommendation regarding any of them, and takes no view on whether the company is well or poorly valued at any price. What follows is an analysis of the machinery that surrounds the security, not of the security itself.
June 12, 2026
Two things began trading in June 2026, and the interval between them was a single trading session.
The first was Space Exploration Technologies Corporation, listing on the Nasdaq under the ticker SPCX after twenty-four years as a private company. The offering was the largest in the history of capital markets by a wide margin. Priced at $135 per share the evening before, the company raised $75 billion at the initial allocation and, following the formal execution of the underwriters' overallotment option, a final total of $85.7 billion. 1 The previous global record was Saudi Aramco's 2019 listing at approximately $29 billion. 1 SpaceX raised nearly three times that. The stock opened at $150, an eleven percent premium to its pricing, and closed the session near $160.95, up roughly nineteen percent, pinning the company's market capitalization at approximately $2.1 trillion. 2 Bell-ringing ceremonies were held simultaneously at the Nasdaq MarketSite in Times Square and at the company's Starbase facility in Texas.
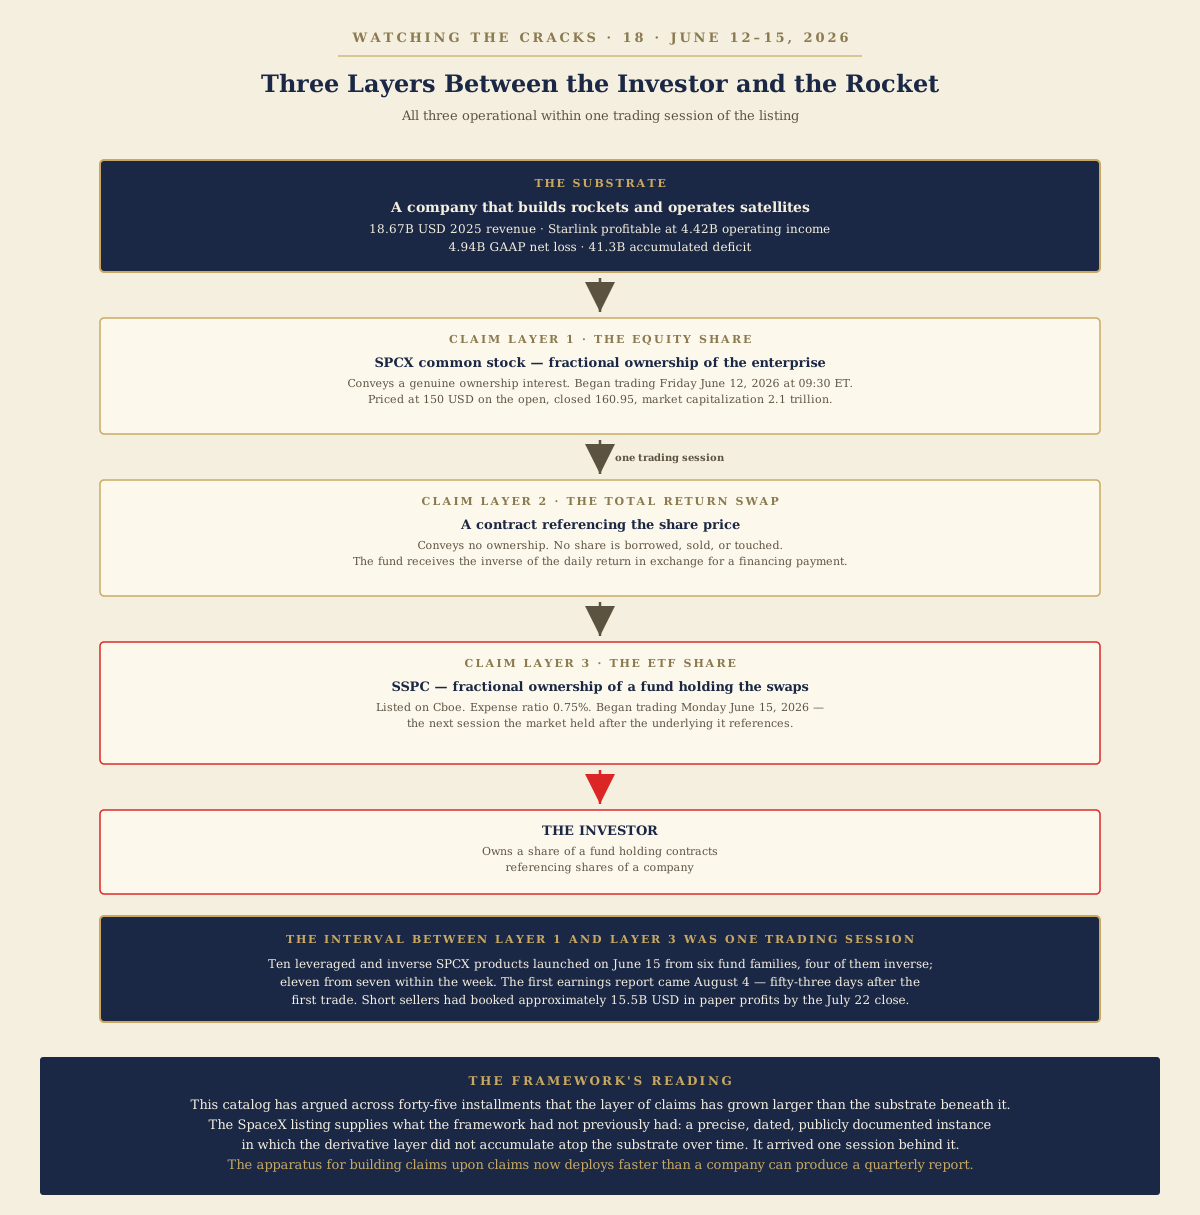
The second thing began trading on Monday, June 15 — the next session the market held. The Leverage Shares 2x Short SPCX Daily ETF, ticker SSPC, listed on the Cboe. 3 It is an actively managed inverse leveraged exchange-traded fund seeking daily results corresponding to negative two hundred percent of the daily percentage change in SPCX. If SpaceX falls one percent in a day, the fund targets a two percent gain. Its net expense ratio is 0.75 percent. 3 And — this is the detail that matters most for everything that follows — it achieves its inverse exposure not by borrowing shares and selling them short, but through total return swaps on SPCX common stock. It is a contract referencing a price. It need never touch a share.
Within days of the listing there were eleven leveraged and inverse SPCX products from seven different fund families. The bullish side included ProShares Ultra SpaceX, Defiance Daily Target 2X Long SpaceX, GraniteShares 2x Long SpaceX Daily, and Leverage Shares 2x Long SPCX Daily. The bearish side included SSPC, Defiance Daily Target 2X Short SpaceX, and GraniteShares 2x Short SpaceX. Ten of the eleven launched on June 15 itself, from six fund families, four of them inverse. Most stocks trade for months or years before an issuer troubles to build a leveraged wrapper around them. SpaceX had ten before its first full week of trading had opened, and eleven before that week was out.
SpaceX reported its first quarter as a public company on August 4, 2026 — fifty-three days after the first trade.
Assemble those facts and the sequence is worth stating slowly. For eight weeks, an investor could hold a negative-two-times leveraged short position on a company, synthesized through swap contracts that referenced its share price without touching its shares, before that company had ever reported a single quarter as a public entity. As of the July 22 close, short sellers had accumulated approximately $15.5 billion in paper profits on the name, according to the analytics firm Ortex, which put the position at roughly 196 million shares — about thirty-one percent of the tradable float, against five to seven percent at the time of the IPO. 4
This catalog has argued across forty-five prior installments that the substitute layer — the accumulated apparatus of claims upon claims that has displaced direct ownership of productive assets — has grown larger than the substrate it rests upon. The SpaceX listing supplies something the framework has not previously had: a precise, dated, publicly documented instance in which the derivative layer did not grow atop the substrate over time. It arrived at the same moment. In the case of the swap-based inverse fund, it arrived referencing a share that the fund itself would never own.
What happened next
Before developing the structural argument, the empirical record deserves to be laid out, because the price action of the following eight weeks is itself instructive. 5
The fixed-price anomaly. The standard mechanics of a large IPO involve announcing an indicative price range, conducting a roadshow, gathering indications of interest through bookbuilding, and narrowing to a final price within — or occasionally above — the announced range. SpaceX did not do this. It went directly to a fixed price of $135 per share, bypassing the range process entirely. 2 The roadshow launched in the first week of June on a compressed schedule relative to typical mega-cap offerings, following a faster-than-expected SEC review of the S-1, which was filed publicly on May 20 after an earlier confidential submission whose date is not on the public record. Twenty-one financial institutions participated in the syndicate under the internal designation "Project Apex," with Goldman Sachs as lead-left bookrunner alongside Morgan Stanley, Bank of America, Citigroup, and JPMorgan Chase. 6
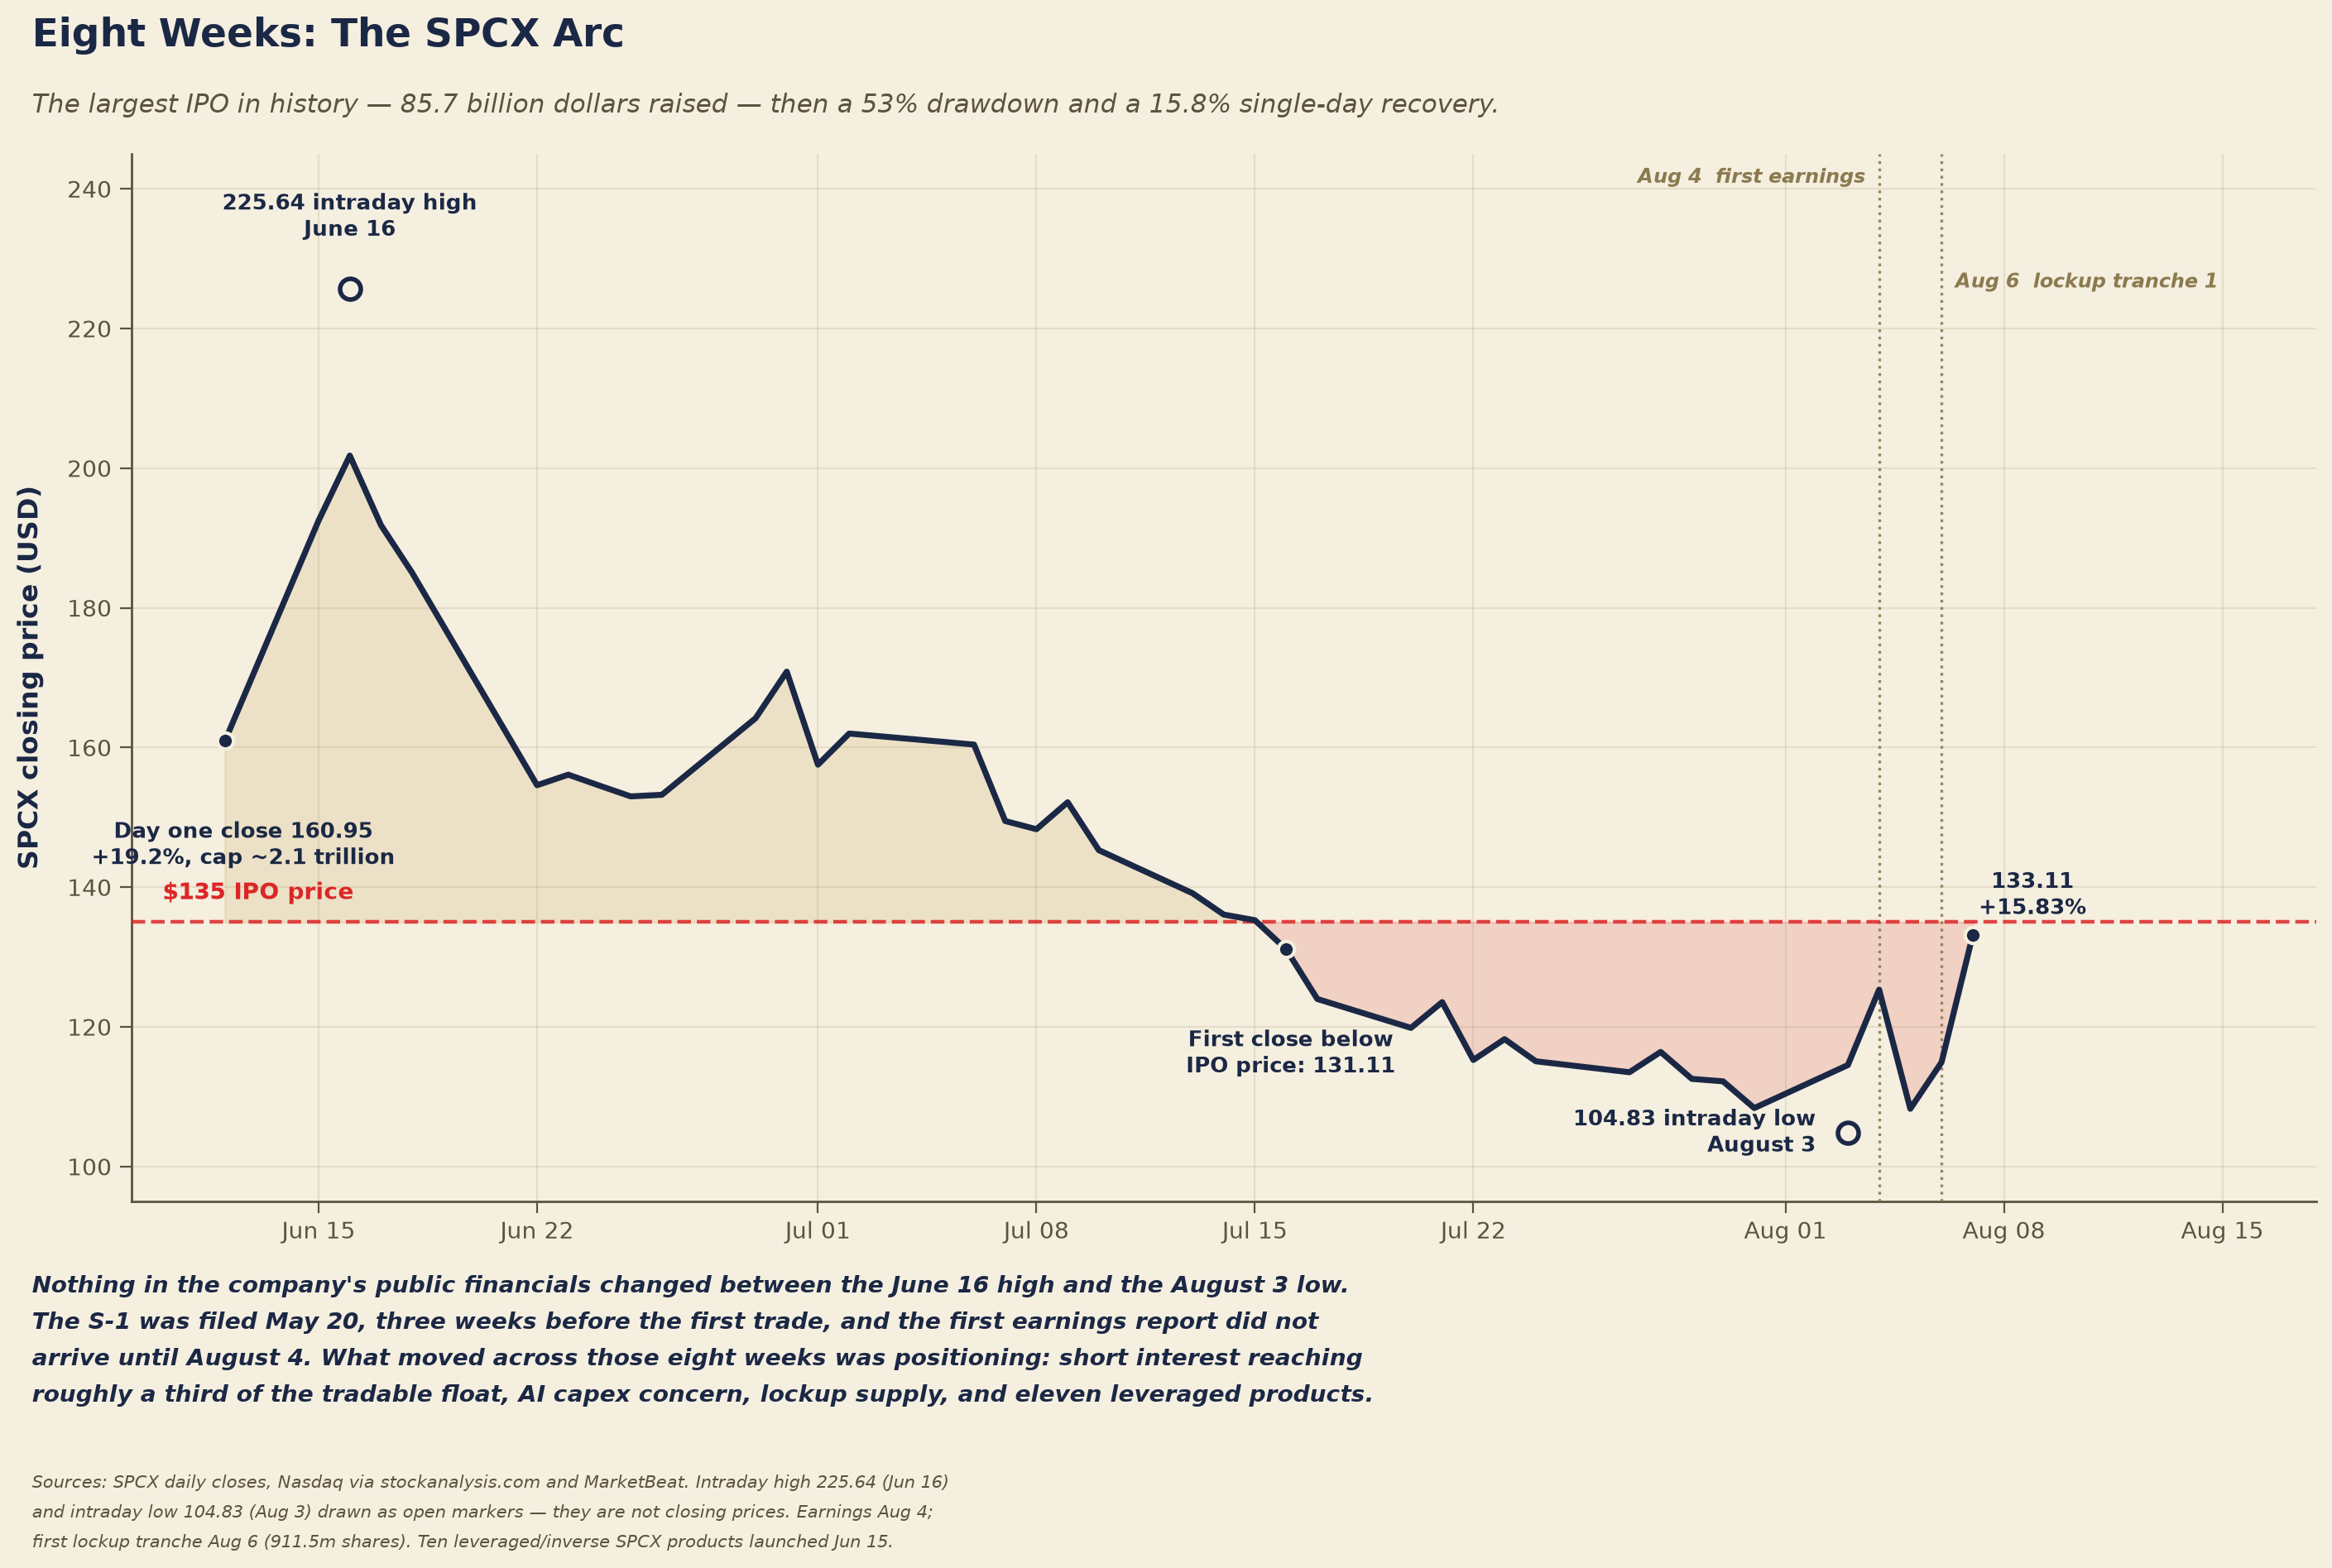
The arc. From the $135 pricing, the stock opened at $150 and closed its first session at approximately $160.95. 2 It subsequently rose to a post-IPO high of $225.64 — sixty-seven percent above the offering price. 7 It then fell, reaching that high on June 16 and breaking below its IPO price by mid-July — the first close under $135 came on July 16, at $131.11. 7 On July 30 it closed at $112.20, roughly fifty percent below its high and well under the price at which it had been sold to IPO participants seven weeks earlier. 7 On August 3 it touched $104.83 intraday. 7 Then earnings landed on August 4: the stock rose 9.43 percent that session to $125.33, fell 13.6 percent the next on capital-expenditure concerns, absorbed the first and largest tranche of its lockup expiration on August 6, and on Friday August 7 rose 15.83 percent in a single session — trading from $114.53 to $133.48 and closing at $133.11, back to within two dollars of its original offering price, and finishing the week up roughly twenty-three percent. 8
The full path, in under two months: $135, then $225.64, then $104.83, then $133. 7 A fifty-three percent drawdown from the high, followed by a fifteen-percent single-day recovery, on a company valued at over two trillion dollars.
What did not change during any of this. SpaceX's operating fundamentals were fully public on May 20, three weeks before the first trade, in the S-1 prospectus. Fiscal 2025 revenue of $18.67 billion. 5 Starlink as the profitable engine, contributing $11.39 billion in revenue and $4.42 billion in operating income. 5 The launch business generating roughly $4.1 billion in revenue against a $657 million segment operating loss, itself the product of $3.0 billion in Starship development spending. 5 The artificial intelligence segment — folded in via the February 2026 merger with xAI at a $1.25 trillion valuation — producing approximately $3.2 billion in revenue against a $6.4 billion loss. 9 Consolidated GAAP net loss of $4.94 billion. 5 Accumulated deficit of $41.3 billion as of March 31, 2026. 5 Positive adjusted EBITDA of $6.6 billion. 5 Musk holding roughly eighty-five percent of voting power on approximately forty-two percent of the equity through a super-voting share class, while serving as founder, chief executive, chief technology officer, and chairman.
None of this changed between $225.64 and $104.83. 10 The company did not become fifty-three percent less valuable as a business over six weeks in which no new financial information was released. What changed was positioning: anxiety ahead of a lockup expiration structured to begin releasing shares in early August, concern over the scale of AI capital expenditure, the accumulation of short interest to roughly a third of the tradable float, and the mechanical flows of eleven leveraged products rebalancing daily against a volatile underlying.
The apparatus, examined
The eleven exchange-traded products that appeared within days of the listing deserve closer structural attention than they typically receive, because their mechanics illustrate the framework's argument with unusual clarity.
Consider what SSPC actually is. An investor purchases a share of the fund. The fund does not use that capital to borrow SPCX shares from a custodian, sell them into the market, and hold the proceeds — which is what shorting a stock conventionally means, and which requires the existence of a lender, a borrow fee, and a real share moving from one account to another. Instead, the fund enters into total return swap agreements with counterparties, under which it receives the inverse of SPCX's daily return in exchange for a financing payment. No share is borrowed. No share is sold. No share is touched. The fund's exposure is a contractual reference to a price series.
This structure is entirely legal, thoroughly disclosed, and operationally routine. It is also, in the framework's terms, a claim upon a claim upon a claim. The productive substrate is a company that builds rockets and operates a satellite constellation. The first claim is the equity share, which represents fractional ownership of that enterprise. The second claim is the swap contract, which references the price of that share without conveying any ownership of it. The third claim is the ETF share itself, which represents fractional ownership of a fund whose assets consist principally of the swap contracts. An investor holding SSPC owns a share of a fund holding contracts referencing shares of a company. Between that investor and a rocket sit three distinct layers of legal claim, none of which conveys any right to the rocket.
The framework's specific observation is not that this is fraudulent or that it should be prohibited. It is that the entire structure was operational on day one — that the layering did not accumulate over years of a security's trading life but was manufactured, by seven independent fund families simultaneously, within seventy-two hours of the underlying's first trade. The apparatus for building claims upon claims is now sufficiently industrialized that it deploys faster than a company can produce a quarterly report.
The inverted pyramid
Step back from the specific case to the aggregate, and a structural fact emerges that is rarely stated in plain terms.
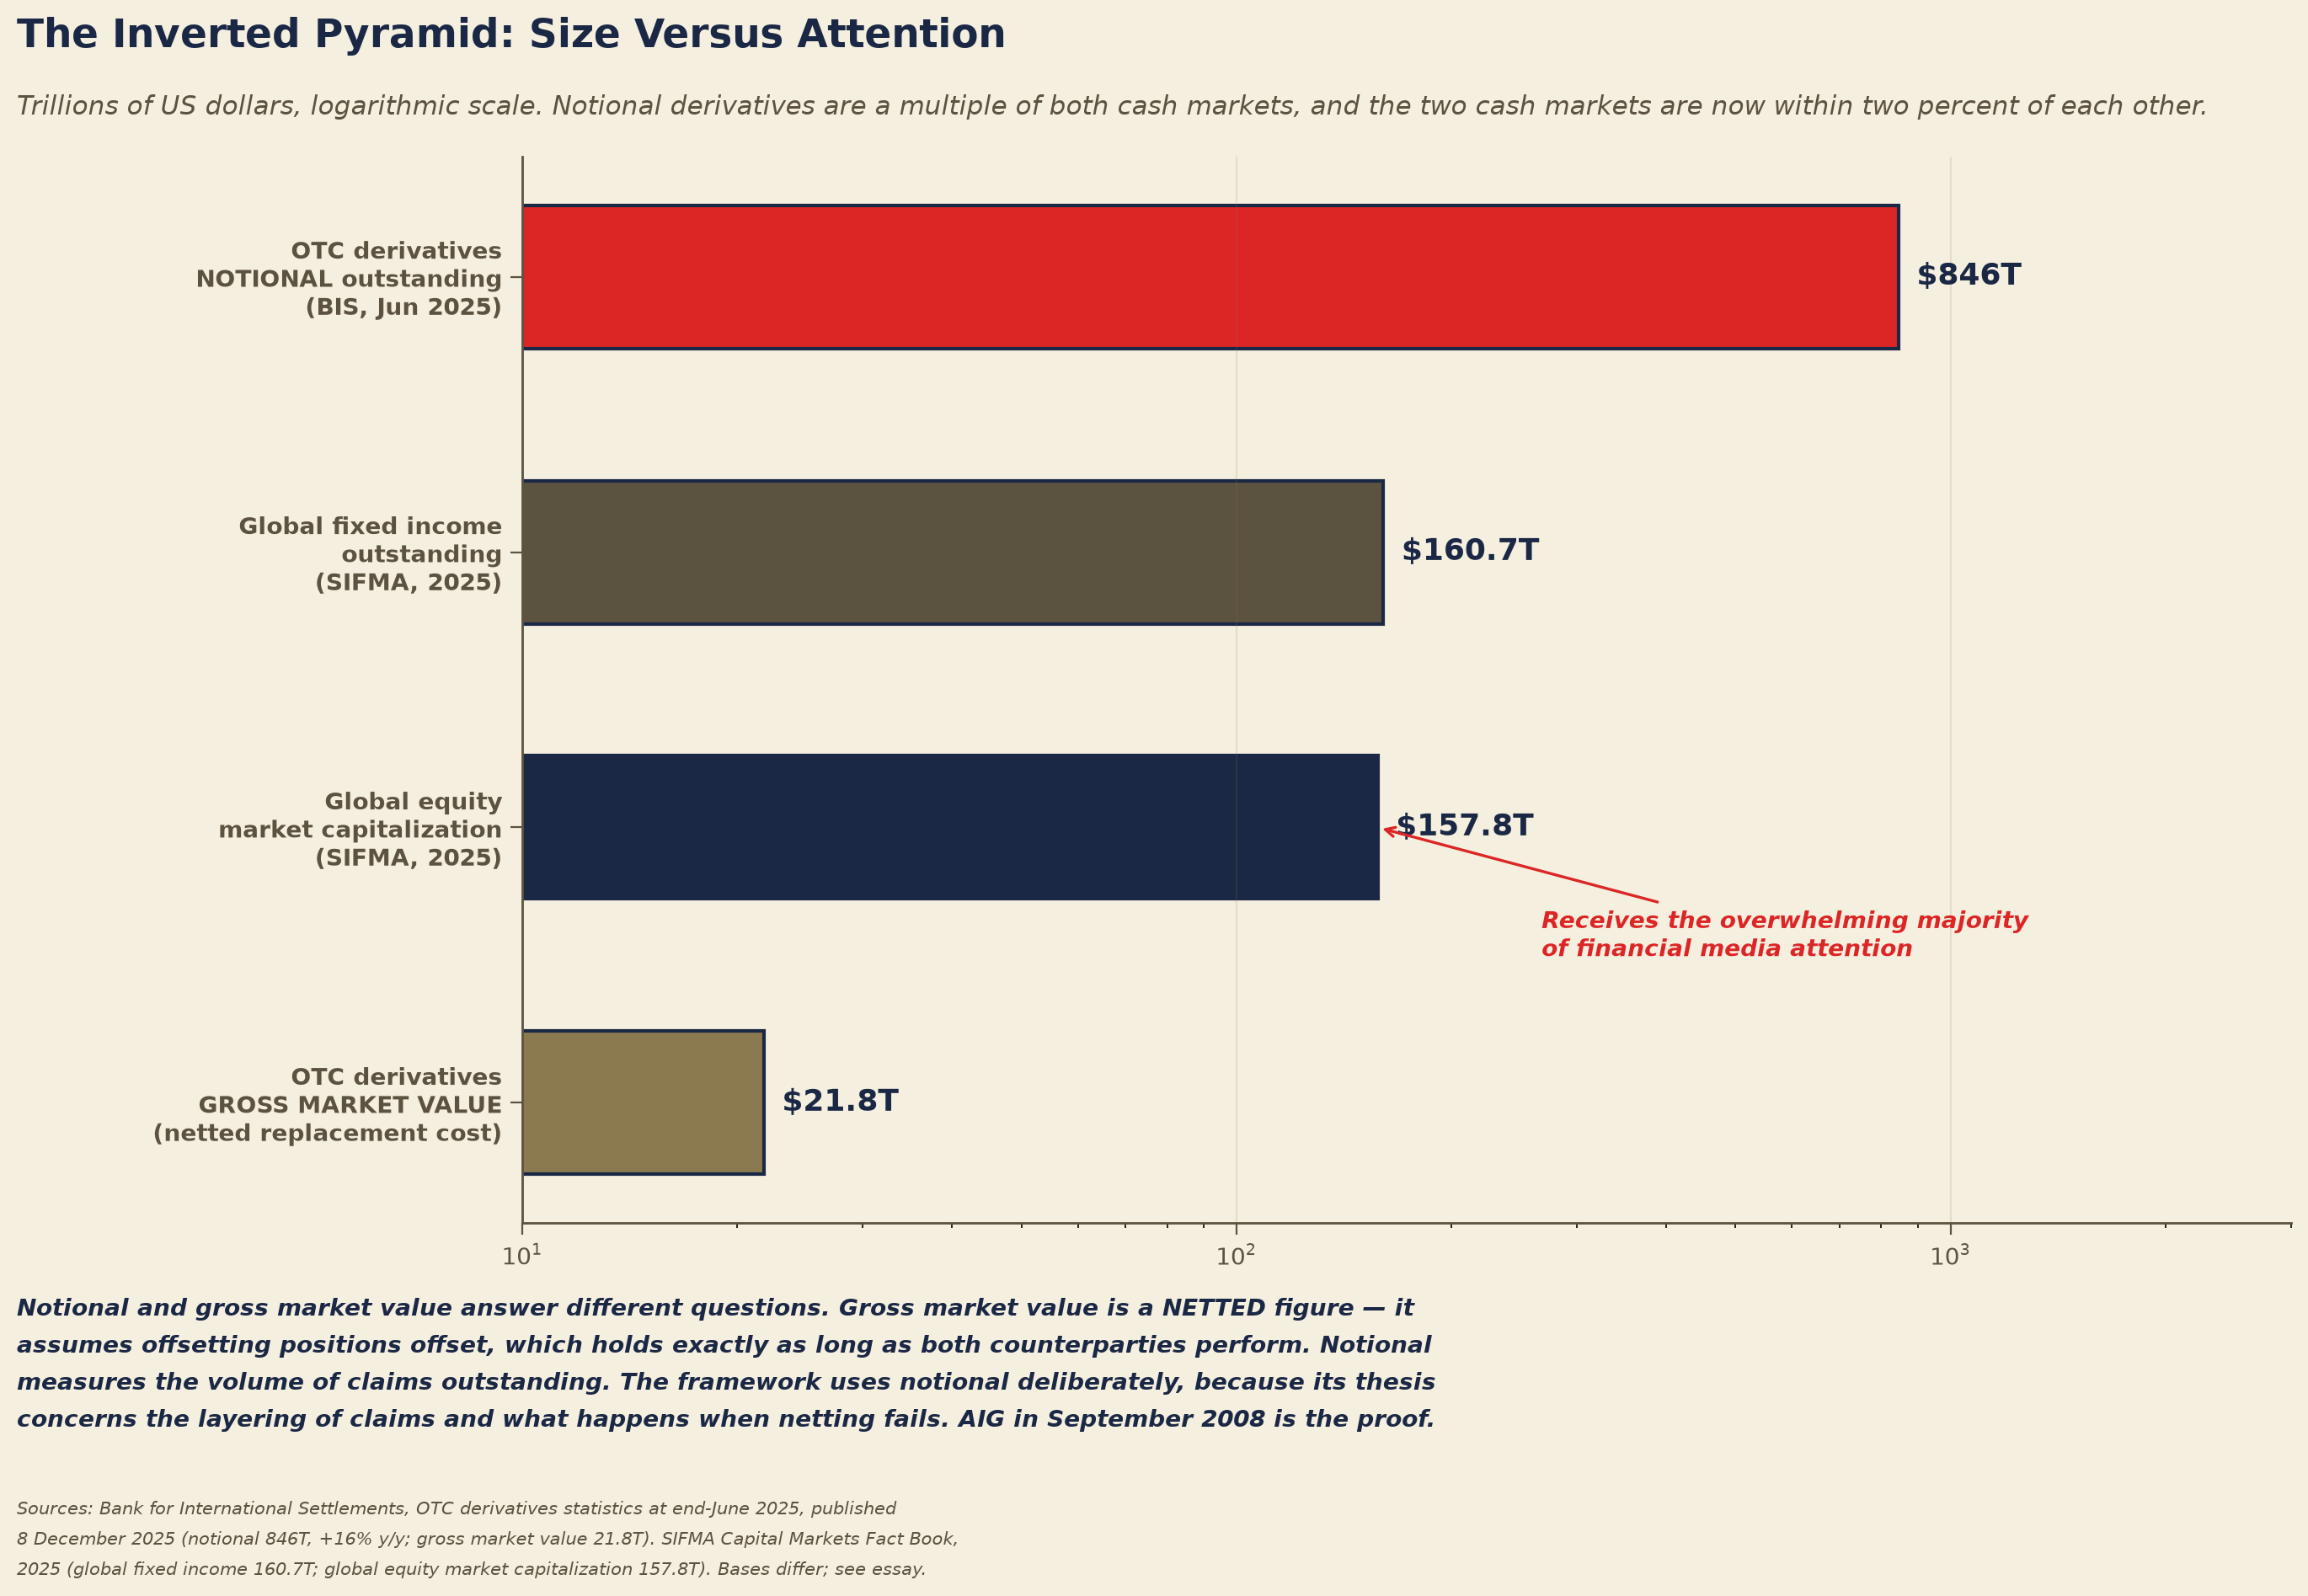
According to the Bank for International Settlements, the notional value of outstanding over-the-counter derivatives stood at $846 trillion at June 2025, up sixteen percent from June 2024 — an acceleration from the roughly five percent annual trend that had prevailed since 2016. 11 The foreign exchange risk category alone accounted for $155 trillion of that notional, of which approximately $100 trillion consists of forwards and swaps maturing within a year. 11 Credit derivatives, tracked separately by the International Swaps and Derivatives Association in its survey of OTC markets in the second half of 2025, reached $11.3 trillion in notional outstanding at year-end 2025 from $9.2 trillion a year earlier, having grown 22.1 percent in twelve months. 12
Against this, the same institutions report that global debt securities outstanding exceeded $156 trillion as of August 2025, with the U.S. dollar accounting for roughly forty percent of the total. 13 And global equity market capitalization — the market that dominates financial media, retail attention, and popular conception of what "the market" means — stood at approximately $158 trillion at the end of 2025 on SIFMA's tally, having risen almost nineteen percent in a year. 13
Arrange those figures and the pyramid is inverted relative to attention. Measured by notional, the derivatives complex is roughly five times the size of either cash market. Bonds and equities are now close to parity — on SIFMA's 2025 figures, $160.7 trillion of fixed income against $157.8 trillion of equity, a gap under two percent, where the bond market held a clearer lead a year earlier. 13 The framework does not need the ordering between those two to make its point, and states the parity rather than resting on a stale equity figure. What matters is the third comparison: the derivatives complex is a multiple of both, and it is the smaller of the two cash markets that receives something approaching the entirety of public financial coverage.
This inversion is not incidental to the framework's broader argument; it is close to being the argument. Article 41 developed the accounting asymmetry by which falling interest rates destroy capital, and that mechanism lives entirely in fixed-rate debt — the bond market. Article 45 examined what a sovereign coupon actually is, and that analysis lives in the bond market as well. Article 34 documented the divergence between paper claims on gold and physical metal, which lives in the derivatives complex. The three phenomena this catalog regards as most consequential all occur in the two markets that receive the least attention, while the market that receives nearly all of it is the smallest and, in a specific sense developed below, the most downstream.
The objection, and why it does not dispose of the argument
The figures above invite an immediate and legitimate objection, and the framework's credibility depends on engaging it directly rather than hoping readers do not raise it.
The objection is that notional value is not comparable to market capitalization, and that using it this way inflates the derivatives complex misleadingly. This is correct on its own terms. Notional is the reference amount against which a contract's payments are calculated; it is not the amount at risk. The BIS reports a second figure alongside notional — the gross market value of outstanding OTC derivatives, which represents the cost of replacing all contracts at current market prices — and that figure stood at $21.8 trillion at June 2025. 11 Twenty-one point eight trillion is not larger than global equity market capitalization. It is roughly one-sixth of it. Measured this way, the derivatives complex is a fraction of the equity market rather than a multiple of it, and the pyramid is not inverted at all.
Sophisticated readers will make this objection, and the framework grants that gross market value is the correct measure for the question how much economic exposure would be lost if all these contracts were settled today under normal conditions.
But that is not the question the framework is asking, and the difference is precise. Gross market value is a netted figure. It assumes that offsetting positions offset — that a dealer with a long swap to one counterparty and a matching short swap to another has, in economic substance, no position. That assumption is correct exactly as long as both counterparties perform. It is a statement about the world conditional on the substrate holding.
The framework's entire body of work concerns what happens when the substrate does not hold. And in that state, netting is precisely what stops working, because netting depends on counterparty performance and counterparty performance is what fails first. This is not a hypothetical. It is what occurred in September 2008, when American International Group's derivative book — modest in net terms, catastrophic in gross terms — required an $85 billion federal facility precisely because the netting assumption dissolved when the counterparties on one side could no longer perform. The gross figure was the true figure at the moment it mattered, and the net figure was an accounting convenience that described a world that had ceased to exist.
So the framework uses notional deliberately, and states why: notional measures the volume of claims outstanding, and the framework's thesis concerns the layering of claims. Gross market value measures net economic exposure under the assumption that the system functions, and the framework's thesis concerns what the system looks like when it does not. Both figures are correct. They answer different questions, and readers should know which question is being asked.
The index a $2.1 trillion company cannot join
There is a specific institutional detail about the SpaceX listing that illuminates the relationship between the equity market's actual composition and the index that stands in for it.
At approximately $2.1 trillion in market capitalization on its first day, SpaceX would rank among the largest companies in the United States — comfortably a top-five constituent of the S&P 500 by size, ahead of most of the Magnificent Seven. 14 It is not in the S&P 500, and under current methodology it cannot be.
The S&P 500's inclusion criteria require, among other conditions, positive generally accepted accounting principles earnings in the most recent quarter and in the sum of the trailing four quarters, a twelve-month seasoning period, and a minimum public float of ten percent. CME Group's analysis of the listing recorded that S&P kept its float, profitability and seasoning criteria in place, and that SpaceX's float at IPO was about four percent of shares outstanding. SpaceX reported a consolidated GAAP net loss of $4.94 billion for fiscal 2025 and a further $4.3 billion in the first quarter of 2026, against an accumulated deficit of $41.3 billion. 5 It does not meet the profitability test. Whatever its adjusted EBITDA of $6.6 billion may indicate about the underlying business, the index rule is written against GAAP earnings, and by that measure the company does not qualify.
The result is a structural oddity worth sitting with. The largest capital raise in the history of financial markets produced a company that, by market capitalization, would immediately be among the most significant components of the benchmark that most Americans hold through retirement accounts — and that benchmark cannot include it. S&P Dow Jones Indices considered and then declined to fast-track mega-cap listings, keeping the profitability, seasoning and float tests in force; on current segment trajectories that puts inclusion no earlier than 2027. Index investors who believe they own "the market" through an S&P 500 fund own no part of the largest listing ever conducted.
The qualification the framework owes the reader is that this is specific to the S&P 500. Nasdaq moved the other way, dropping its ten percent float minimum and opening Nasdaq-100 entry to top-forty listings fifteen trading days after debut, so holders of a Nasdaq-100 fund do own the listing that S&P 500 holders do not. 15 The exclusion is a fact about one index's methodology, not about index investing as such — which makes the point about knowing what one actually holds sharper rather than weaker.
Meanwhile the index they do own has become something quite different from a broad market proxy. As of mid-2026, the Magnificent Seven constituted approximately thirty-four to thirty-five percent of the S&P 500 by weight — a figure that stood at roughly a third of that level in the late 2010s and first exceeded thirty percent in 2023; the framework could not locate a published series precise enough to date the earlier reading to a particular year. The top ten holdings represent somewhere between thirty-eight and forty-one percent of index value depending on the measurement date. Nvidia alone accounts for roughly eight percent of the entire index — the largest weight any single company has carried since the early 1980s — with a market capitalization above $5 trillion. 14 The remaining 490-odd companies share the balance.
Concentration, stated fairly
The framework's institutional position requires stating the concentration data accurately rather than selectively, including the parts that cut against the alarming reading.
The bare comparison is genuinely striking: the top ten S&P 500 constituents now represent approximately thirty-nine to forty-one percent of index value, against roughly twenty-seven percent at the peak of the 2000 technology bubble. On the single measure of concentration, the present configuration exceeds the most notorious equity bubble in living memory by a substantial margin. The historical average for top-ten concentration is approximately twenty-four percent across the 1880-2010 span. On the prior comparable episode the framework must report that its sources disagree materially: published estimates put the Nifty Fifty peak anywhere from the mid-twenties to around thirty percent, and date it to 1972 or 1973 rather than 1970. What survives the disagreement is the ordering — the present configuration sits above any prior reading on any of these series — rather than a specific prior figure.
But concentration measured by market value alone is an incomplete statistic, and the framework should say so. The same companies generating roughly thirty-nine percent of index market value also generate approximately thirty-one percent of index earnings, and according to Russell Investments the Magnificent Seven account for close to seventy percent of the economic profit produced by S&P 500 companies. These are not companies whose weight rests purely on multiple expansion. They are, by a substantial margin, the most profitable enterprises in the index.
The valuation comparison to 2000 reinforces the point in the same direction. At the height of the technology bubble the ten largest S&P 500 companies carried a premium over the rest of the index of roughly one hundred percent. Published comparisons put the present premium at something between a third and a half, depending on whether trailing or forward earnings are used and on the measurement date; the framework has not been able to reconcile the competing versions to a single pair of figures and reports the range rather than picking one. Every version of the comparison points the same way: the large-cap premium today is a fraction of what it was in 2000.
The honest summary: concentration is higher than 2000 and better earnings-supported than 2000. Both halves of that sentence are true, and a framework that reported only the first half would be doing what it criticizes others for doing. What the framework does claim is narrower and, it believes, defensible — that a benchmark in which seven correlated technology-adjacent companies constitute a third of the value is not performing the diversification function that index investing is understood by its holders to provide, whatever the earnings quality of those seven companies may be. The 2026 first half offered a small preview: the Magnificent Seven as a group underperformed the broader index, with only one of the seven beating it, meaning that for the first time in several years the concentration worked against the holder rather than for him.
Fundamentals anchor the destination, not the path
The SpaceX price arc bears directly on a question this catalog engaged in Article 37 and revisited in Article 42: what role fundamental analysis can actually play in an individual's decisions.
The tempting reading of a stock that traveled from $135 to $225.64 to $104.83 to $133 in eight weeks, on unchanged public financials, is that fundamentals are simply irrelevant — that the market is a casino and the reported numbers are decoration. The framework declines this reading, because the evidence does not support it. On August 4, the day of the company's first public earnings report, the stock rose 9.43 percent; the week that followed closed it up roughly twenty-three percent. That is fundamental information moving a price, promptly and substantially. A genuine casino does not reprice on operating results.
The framework should add, because it cuts against the tidiness of the illustration, that the response was not monotonic and not solely about earnings. The session after the report the stock fell 13.6 percent on the scale of AI capital expenditure, and the 15.83 percent move on August 7 came the day after 911.5 million shares were released from lockup, which more than doubled the public float. Earnings moved the price. So did supply. Disentangling the two on an eight-week record is not possible, and the framework does not claim to have done it.
The defensible claim is more precise and, the framework thinks, more useful. Fundamentals anchor the destination. They say almost nothing about the path. And the path is where capital is actually destroyed.
Consider an investor who read the S-1 carefully in May, concluded that Starlink's $4.42 billion of operating income on $11.39 billion of revenue represented a durable and underappreciated franchise, and formed the view that SpaceX at a $1.75 trillion valuation would prove cheap over a decade. That investor may well be correct — the framework has no view on the question. But if that investor expressed the conviction with leverage at $225.64, the subsequent fifty-three percent decline would have destroyed the position long before the thesis had any opportunity to be tested. Being right about the destination while wrong about the path produces the same financial outcome as being wrong about both.
This is precisely the finding Article 42 developed at a twenty-year time scale, examining gold's decline from 1980 to 2000 while the monetary diagnosis that justified holding it remained continuously correct. Being early is indistinguishable from being wrong. The SpaceX case runs the identical mechanism on an eight-week clock, and the compression makes it easier to see. The fundamental analyst who was correct in May was liquidated in July.
Leveraged ETFs as engineered forced sellers
This brings the essay to what the framework regards as its most novel observation, and it extends the analysis of Article 44 in a direction that article did not reach.
Article 44 established that the universal failure mode in wealth destruction is being a forced seller, and identified three conditions that jointly produce it: leverage, illiquidity, and an unavoidable liquidity need. It documented the empirical cost of forced selling across five distinct academic literatures, from a three percent discount on bankruptcy asset sales to twenty-seven percent on residential foreclosures, and demonstrated that the same mechanism produces an approximately twenty-five percent persistent earnings loss for displaced workers. Its practical conclusion was that removing any one of the three conditions is generally sufficient defense, and that the discipline applies to careers as much as to portfolios.
A daily-rebalanced leveraged exchange-traded fund does not merely expose its holder to those three conditions. It engineers all three into the product's operating mechanism, as a matter of design rather than misfortune.
Leverage is explicit and constitutive. A negative-two-times fund holds twice the notional exposure of its net assets by construction. This is not a risk the holder may choose to avoid within the product; it is the product.
Forced transaction at adverse prices is the rebalancing mechanism itself. To maintain a constant negative-two-times daily exposure, the fund must adjust its swap positions at the close of every session. When the underlying rises, the inverse fund's exposure must be increased in the direction that has just moved against it; when the underlying falls, exposure must be reduced. In plain terms, the fund mechanically transacts in the wrong direction after every move — buying more exposure after losses and shedding it after gains. A discretionary trader who behaved this way would be described as undisciplined. In the leveraged ETF it is the specification.
The unavoidable timing is the daily reset. The fund cannot wait for a better price, cannot hold through a drawdown to a more favorable moment, and cannot exercise the patience that Article 44 identified as the single most valuable defense against forced-sale discounts. Its transaction schedule is contractual and its counterparty is the calendar.
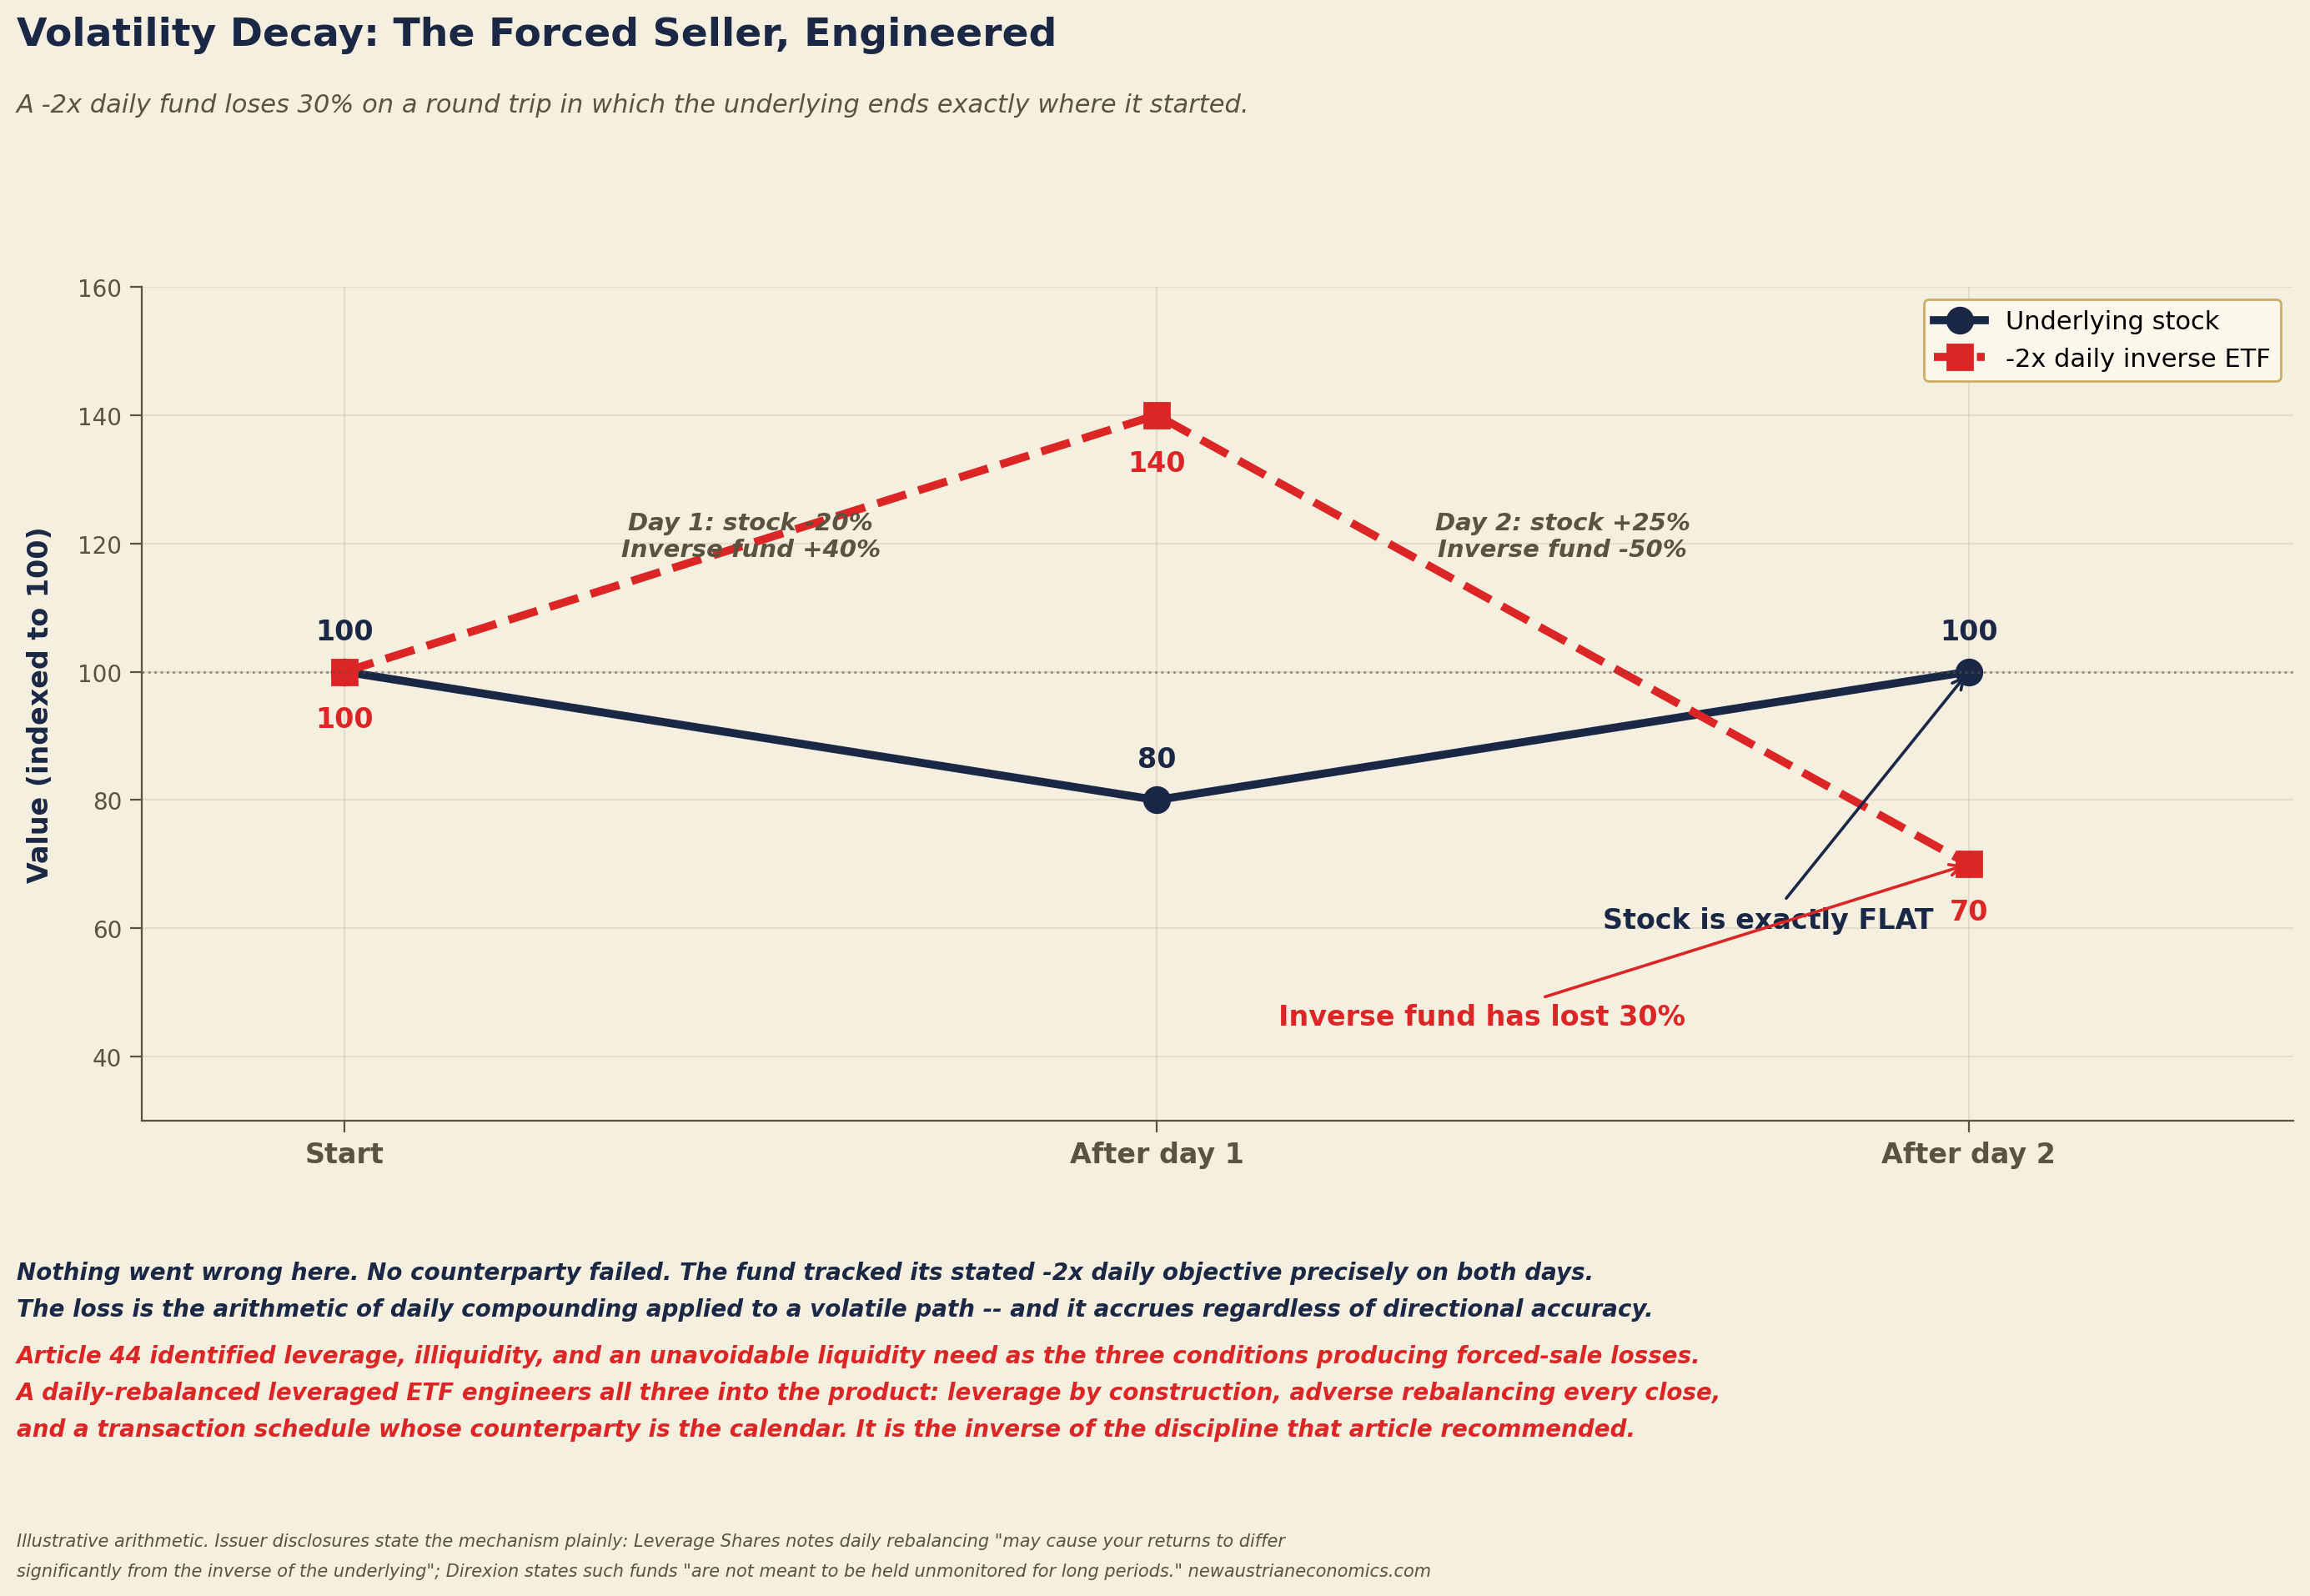
The consequence is volatility decay, and its magnitude is routinely underappreciated. Consider a simplified illustration. An underlying stock falls twenty percent on day one, then rises twenty-five percent on day two, returning exactly to its starting price. A negative-two-times fund gains forty percent on day one, taking $100 to $140; it then loses fifty percent on day two, taking $140 to $70. The underlying is flat. The inverse fund has lost thirty percent of its value. Nothing has gone wrong; no counterparty has failed; the fund tracked its stated daily objective precisely on both days. The loss is the arithmetic of daily compounding applied to a volatile path, and it accrues to the holder regardless of whether his directional view was correct.
The issuers disclose this clearly, and the framework notes that they do. Leverage Shares states plainly that because of daily rebalancing and compounding, "the return of the Fund for periods longer than a single day will very likely differ from -200% of the return of the underlying stock," and that the fund "is designed for short-term trading (intraday or daily)." 3
 Direxion's standard disclosure — carried across its leveraged and inverse commentary, including on SPCX — is blunter still: daily rebalancing ETFs "are not meant to be held unmonitored for long periods," and "if you don't have the resources, time or inclination to constantly monitor and manage your positions, leveraged and inverse ETFs are not for you." That this is boilerplate rather than a special warning about SPCX is the point, not a mitigation. The disclosure is not hidden, and it is not even rare. The question is how many holders have read it.
The framework's specific claim: Article 44 argued that savers should structure their financial lives so as never to be forced sellers of anything. A daily-rebalanced leveraged ETF is a product in which the holder has delegated forced selling to a mechanism that performs it every single session, at the closing price, without regard to whether the price is favorable. It is the precise inverse of the discipline that article recommended — and, in a volatile underlying like SPCX during its first eight weeks, it is a mechanism that can produce losses for holders on both sides of a correct directional view.
Why the technical levels held
One final observation, which the framework offers with a specific theoretical grounding rather than as an endorsement of any trading method.
Technical commentary on SPCX during its August recovery — market notes rather than a published call the framework can attribute — read a double bottom in the $105 to $110 region, resistance at $118 to $120, a target at $135 (the IPO price), and a subsequent objective of $155 to $160 on a decisive break above. 7 Those levels are best treated as illustrative of how the chart was being read at the time rather than as a documented forecast. The price action is on the record, and the stock traced approximately that path: it based in the $105 to $110 area, broke through $118 to $120, and ran to $133.48 intraday on August 9, stalling just below the $135 IPO price.
Article 37 developed the framework's position on why such levels hold, and it is worth restating because it is not the position either the enthusiasts or the skeptics typically take. Fibonacci retracements and similar tools do not work because there is anything mystically significant about the golden ratio in financial markets. They work, when they work, because a sufficient number of participants use the same tools, draw the same lines on the same charts, and place orders near the same levels. This makes them self-referentially predictive — a coordination equilibrium in which the pattern exists because participants believe it exists, and persists as long as enough participants continue to believe.
The SPCX case adds a specific reinforcing feature that the framework had not previously noted. The $135 level is not merely a technical construct; it is the price at which every IPO allocation was struck. Institutional and retail participants who received allocations have a psychologically and often professionally salient reference point at exactly that number, and behavior clusters around it for reasons that have nothing to do with chart geometry and everything to do with the human tendency to evaluate outcomes against a purchase price. When a technical level and a widely shared behavioral anchor coincide, the coordination equilibrium is stronger than either would be alone.
The framework's practical reading is unchanged from Article 37 and Article 42: technical tools describe the behavior of participants, not the value of enterprises, and they are useful for precisely that and no more. The investor who understands why a level holds is in a better position than one who believes the level is intrinsic, because he knows what would cause it to stop working — a change in who is participating and what they are watching.
The framework's synthesis
The SpaceX listing will be remembered for its size. The framework's reading is that its more durable significance is the simultaneity.
The company raised $85.7 billion, more capital than any enterprise in history has raised in a single offering, to build rockets and satellites and artificial intelligence infrastructure — that is, to deploy productive capital against physical assets in the world. One trading session later, in the same market, ten leveraged and inverse products came into being at once, four of them bearish, several referencing the company's share price through swap contracts that will never touch a share. Eight weeks would pass before the company reported its first quarter as a public entity, and across those eight weeks the apparatus operated continuously, generating approximately $15.5 billion in paper profits for short sellers on a company whose public financial disclosure consisted of a single prospectus.
Against the aggregate backdrop developed above — $846 trillion in outstanding derivative notional against roughly $160 trillion in bonds and $158 trillion in equities — the SpaceX case is not an anomaly. 11 It is a legible, dated instance of the general condition. The layer of claims is not merely larger than the substrate. It is faster than the substrate, and it now assembles itself around a new productive asset before that asset has produced a single public accounting of what it does.
What the framework takes from this, and offers to readers as the practical residue of the analysis: the market most people watch is dwarfed by the derivatives complex and no larger than the bond market; the index most people hold has become a concentrated position in seven correlated companies and structurally excludes the largest listing ever conducted; fundamental analysis identifies destinations and is nearly silent on the paths that determine whether anyone survives to arrive; and the products that promise magnified participation in those paths have institutionalized, as their operating mechanism, exactly the behavior that this catalog's Article 44 identified as the universal failure mode.
None of that argues against participation in equity markets, and the framework makes no such argument. It argues for participating with an accurate picture of what the machinery is — which, on June 12, 2026, was visible in a single day's trading with unusual clarity.
This is the eighteenth installment of Watching the Cracks. The framework holds no position in SPCX or in any exchange-traded product referenced, and this essay constitutes analysis of market structure rather than a recommendation regarding any security. Predictions recorded for future testing: (1) the remaining lockup tranches — the schedule runs in nine stages from the 911.5 million shares released on August 6, 2026 through the final 180-day release on December 8, 2026 — will produce measurably elevated volatility in SPCX and correspondingly elevated volatility decay in the leveraged products tracking it; (2) the number of leveraged and inverse single-stock products will continue to expand across newly listed large-capitalization companies, with the interval between listing and derivative launch remaining at or under one trading session; (3) SpaceX will not meet S&P 500 GAAP profitability criteria before the second half of 2027 on current segment trajectories; S&P Dow Jones Indices has already declined to relax the criteria for mega-cap listings, so inclusion before that date would require it to reverse that decision rather than SpaceX to reverse its losses.
Sources
Footnotes
-
Underwriters exercised the greenshoe on 15 June for a further 83.3 million shares, bringing the total to $85.7 billion. The prior record was Saudi Aramco's December 2019 listing at $29.4 billion after its own greenshoe. ↩ ↩2
-
Nasdaq listing data and contemporaneous reporting, 11–12 June 2026. https://www.nasdaq.com/ — SpaceX priced at $135 on 11 June 2026 and began trading on the Nasdaq as SPCX on Friday 12 June, opening at $150 and closing at $160.95 for a market capitalization near $2.1 trillion. The offering raised $75 billion on 555.56 million shares. ↩ ↩2 ↩3
-
Leverage Shares 2x Short SPCX Daily ETF (SSPC) — inception 15 June 2026, Cboe, 0.75 percent expense ratio, exposure via total return swaps, futures and options, with the issuer's own disclosure on daily rebalancing and holding periods. Ten leveraged SpaceX ETFs launched on 15 June, the first session after the debut, from six issuers; eleven from seven fund families within the week. ↩ ↩2 ↩3
-
Short-seller paper profits of approximately $15.5 billion as of the 22 July close, with the position at roughly 196 million shares or about 31 percent of tradable float, per Ortex via Reuters. ↩
-
SpaceX Form S-1, filed 20 May 2026 — fiscal 2025 revenue $18.67bn; Connectivity (Starlink) revenue $11.39bn and operating income $4.42bn; Space segment $4,086m revenue against a $657m operating loss, driven by $3,004m of Starship development spending; AI segment approximately $3.2bn revenue against a $6.36bn operating loss; consolidated GAAP net loss $4.94bn; accumulated deficit $41.3bn; positive adjusted EBITDA $6.6bn; Musk holding approximately 85.1 percent of voting power on roughly 42 percent of the equity. ↩ ↩2 ↩3 ↩4 ↩5 ↩6 ↩7 ↩8
-
Twenty-one banks worked the deal under the internal codename Project Apex, with Goldman Sachs lead-left alongside Morgan Stanley, JPMorgan Chase, Bank of America and Citigroup as active bookrunners. ↩
-
SPCX daily closes from Nasdaq via stockanalysis.com and MarketBeat, cross-checked on overlapping sessions — all-time high $225.64 intraday on 16 June; first close below the IPO price on 16 July at $131.11; $112.20 on 30 July; all-time intraday low $104.83 on 3 August; $125.33 on 4 August (+9.43 percent) after the first earnings report; $108.27 on 5 August (−13.6 percent); $114.92 on 6 August; $133.11 on 7 August (+15.83 percent, range $114.53–$133.48). ↩ ↩2 ↩3 ↩4 ↩5 ↩6
-
SpaceX Form S-1 lockup schedule. https://www.sec.gov/edgar/search/ — The lockup expiration runs in nine tranches rather than a single date. The first and largest released 911.5 million shares on 6 August 2026, lifting freely tradable float from 4.9 to 11.8 percent of shares outstanding; subsequent tranches run through the final 180-day release on 8 December 2026. ↩
-
The xAI combination closed in February 2026 at a $1.25 trillion valuation. ↩
-
S&P 500 eligibility requires positive GAAP earnings in the most recent quarter and over the trailing four quarters, a twelve-month seasoning period, and a minimum ten percent public float; S&P Dow Jones Indices declined to relax those tests for mega-cap listings. ↩
-
Bank for International Settlements, OTC derivatives statistics at end-June 2025, published 8 December 2025 — notional outstanding $846 trillion, up 16 percent year on year against a roughly 5 percent trend since end-2016; gross market value $21.8 trillion; foreign exchange derivatives $155 trillion notional, of which $100 trillion are forwards and swaps maturing within a year. ↩ ↩2 ↩3 ↩4
-
International Swaps and Derivatives Association credit derivatives statistics. https://www.isda.org/category/research/ — Credit derivatives notional outstanding, tracked separately from the BIS series. ↩
-
Global fixed income outstanding of $160.7 trillion and global equity market capitalization of $157.8 trillion, both 2025, from the SIFMA Capital Markets Fact Book. The two cash-market figures share a vintage; the derivatives figures are as of June 2025 and the bases are not identical, which is why the comparison is stated as a multiple rather than a ratio to the decimal. ↩ ↩2 ↩3
-
Magnificent Seven weight of approximately 34 percent of the S&P 500 as of June 2026; top-ten weight of approximately 40 percent against roughly 27 percent at the 2000 peak; Nvidia at roughly 8 percent of the index on a market capitalization above $5 trillion, the largest single-stock weight since the early 1980s. Top-ten share of index earnings of approximately 31 percent, and the Magnificent Seven at close to 70 percent of S&P 500 economic profit per Russell Investments. ↩ ↩2
-
CME Group, "The SpaceX Mega-IPO: Why Index Choice Matters" — S&P kept its float, profitability and seasoning criteria in place, SpaceX's float at IPO was about 4 percent of shares outstanding, and Nasdaq dropped its ten percent float minimum and opened Nasdaq-100 entry to top-forty listings fifteen trading days after debut. ↩
Related essays