Researched and drafted with AI assistance · reviewed and edited by Jason D. Keys
The Canadian numbers
Between January 1 and September 30, 2026, the real estate platform Zealty.ca recorded 946 court-ordered property listings across Greater Vancouver and the Fraser Valley — a ten-year high. 1
The trajectory is what makes the figure legible. Court-ordered inventory in the Vancouver region totaled 28 listings in October 2023, 66 in October 2024, and 119 in October 2025. 2 For the full year 2025 the regional total reached 773, roughly three times the annual average recorded between 2017 and 2022. 3 The first eight months of 2026 alone produced 845. 3 If the remainder of the year matches the pace of the first eight months, the 2026 total exceeds 1,200. 4
Court-ordered listings arise from several legal circumstances — bankruptcies and family-law proceedings among them — but foreclosures constitute the majority. 3
The price data runs in the same direction. The Metro Vancouver benchmark stood at $1,075,900 in September 2026, down 5.5 percent year over year. Detached benchmark prices fell 7.3 percent to $1,784,700; townhouses 4.7 percent; apartments 6.2 percent to $682,500. Sales totaled 1,717, down 8.4 percent from September 2025. 5 Royal LePage reported aggregate Greater Vancouver prices down 4 percent year over year with transaction volumes running 25 to 30 percent below the ten-year average. 6
Nationally, September 2026 marked what one tracker called a renewed setback, with both the national average and benchmark prices below year-earlier levels and the sales-to-new-listings ratio at 48.8 percent. 7
And the delinquency data confirms it is not purely a volume story. Ontario's mortgage balance delinquency rate rose from 0.24 percent in the first quarter of 2025 to 0.36 percent in the first quarter of 2026 — an increase of 52 percent. 1
The detail that breaks the 2008 template
Most coverage of these figures reaches for the financial crisis as its reference. That comparison fails on the single most informative fact in the data.
The stress has moved up-market.
The firm that compiles the data says so directly. Hamidreza Etebarian, president of Zealty, describing how this cycle differs from the last: "There is a big difference between this crisis and the previous one." And on where the difference shows up: "Back in the day, we wouldn't really see any properties in West Van, or Vancouver West Side, expensive properties being foreclosed." 4
The 2008 pattern he contrasts it against ran the other way. Court-ordered sales then appeared in the relatively affordable parts of the region — the Fraser Valley and the Tri-Cities — typically when middle-class homeowners fell on hard times. 4
That inversion is the article. In 2008 the stress originated in underwriting: loans were made to borrowers who could not service them, and the failures concentrated where those loans were concentrated, which was the inexpensive periphery. The present pattern is the opposite. The failures are appearing in the most expensive postal codes in the country, among borrowers whose credit quality was never the question.
A credit-quality event sorts by borrower. This one is sorting by balance size — and that points at the liability rather than at the borrower.
The mechanism: the term ends
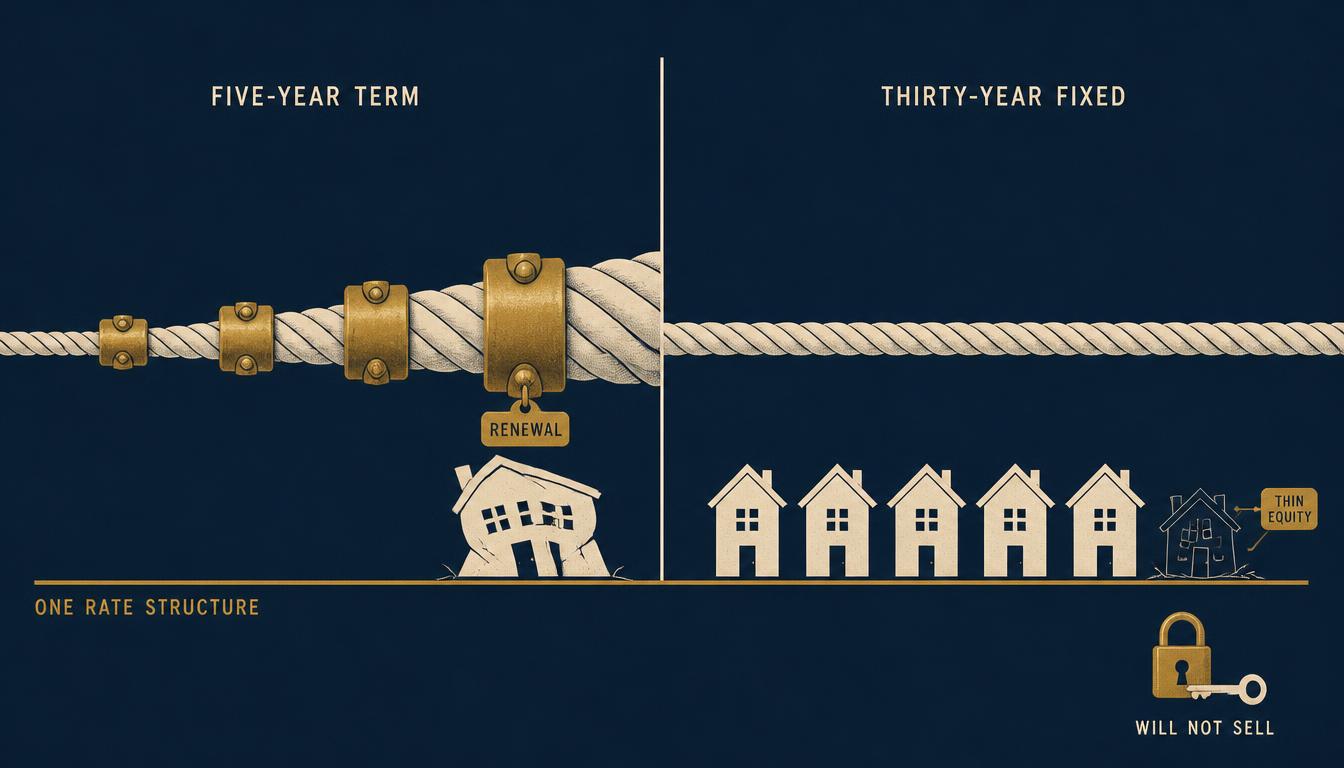
Canadian mortgages do not fix the rate for the life of the loan. The standard arrangement amortizes over twenty-five years but fixes the rate for a term, most commonly five years, after which the loan must be renewed at prevailing rates.
The consequence is that a Canadian borrower who financed in 2020 or 2021 at pandemic-era rates was not holding a long-duration fixed liability. He was holding a short one, and it has now matured into a different interest-rate environment.
Industry participants have described the resulting wave in plain terms. Adam Major, managing broker at Holywell Properties, told Business in Vancouver that "we are only at the beginning of the big mortgage renewal wave," with elevated renewals expected well into 2026. 2 Equifax data indicated roughly a million Canadian mortgages coming due for renewal in a single year from the low-rate originations of 2020. 8 One borrower profiled in coverage of the court-ordered listings — a construction-sector worker in Port Moody facing his second renewal — has been described as facing payment increases in the range of several hundred to roughly a thousand dollars a month. 9
Two further features of the mechanism matter for reading the data.
Foreclosure is a lagging indicator. The process takes upwards of twelve months from the point a borrower first falls behind to the point a property is listed under court order. 2 The 946 listings recorded through September 2026 therefore reflect distress that began in 2025. Whatever is happening at renewal tables now will not appear in these figures until late 2027.
And the market cannot absorb the supply. A Royal LePage broker described the shift from 2021 with a single comparison: "If 2021 felt like there were 50 buyers for every home listed in Vancouver… now you have 50 listings for every buyer." 6
The American numbers, which are not what the comparison usually assumes
The reflexive juxtaposition holds that Canada is cracking and the United States is fine. The data does not support it.
American foreclosure activity also reached multi-year highs in 2026. Active foreclosure inventory climbed to 280,000 loans by May, up 34 percent year over year and the highest level in six years, with serious delinquencies up 111,000 over the same period. 10 Cotality reported the national foreclosure inventory rate rising to 0.4 percent in March — also a six-year high, and the first increase in more than a year — with increases appearing in 77 percent of United States metros and higher year-over-year delinquency rates in 40 states. 11 ATTOM recorded foreclosure filings up 15 percent year over year in the second quarter. 12 The Mortgage Bankers Association put the overall delinquency rate at 4.37 percent in the second quarter, down slightly from the first quarter but up 44 basis points from a year earlier, with the foreclosure inventory rate up nearly 20 basis points. 13
Both countries are under stress. The question is where it is located.
Where American stress actually sits
Here the American data produces a split as informative as the Canadian one, and pointing in a different direction.
Within the Mortgage Bankers Association's own survey, which measures every loan type on the same basis, FHA-insured mortgages carried a delinquency rate of 11.79 percent in the second quarter of 2026 against 2.72 percent for conventional loans and 4.89 percent for VA. 13 The comparison is drawn inside a single survey deliberately; the Federal Reserve's bank-booked series runs far lower because it covers only loans retained on commercial bank balance sheets, and a ratio taken across the two overstates the gap. 14
That is a ratio of better than four to one between FHA and conventional, and the year-over-year changes run the same direction: delinquency rose 12 basis points for conventional loans, 57 basis points for VA loans, and 122 basis points for FHA loans. 13 The FHA seriously delinquent rate — ninety days past due or in foreclosure — reached 2.06 percent, up 49 basis points from a year earlier. 12
American stress is not distributed across the market by balance size. It is concentrated among borrowers with the lowest down payments and the thinnest equity — which is to say, among those who were marginal at origination.
That is a credit-quality event. The Canadian pattern is not.
The variable that explains both
One contractual difference accounts for the divergence.
The Canadian borrower's liability reprices. The American borrower's does not.
A thirty-year American fixed-rate mortgage is a genuinely long-duration fixed obligation. A borrower who financed at 3.2 percent in 2021 pays 3.2 percent in 2026, in 2031, and until the loan is retired. Rising rates do not reach him. The only American borrowers who break are those whose payment was already at the limit of what they could service — which is exactly what an FHA delinquency rate better than four times the conventional rate describes.
A five-year Canadian term is not a long-duration liability. It is a sequence of short ones. When each term ends the borrower is returned to the market, and the increase applies regardless of his credit quality, his payment history, or his equity. It applies in proportion to the size of the balance — which is why West Vancouver is producing court-ordered listings at nearly four times its post-2008 rate while the suburbs that defined 2008 are quiet.
Same rising rate structure. Two sorting mechanisms. The term is the variable.
Fekete, and the gain nobody records
This is where the framework's own apparatus supplies something the housing coverage does not.
Article 41 of this catalog developed Fekete's Law of Liabilities: the principle, absent from general accounting standards, that a liability should be carried at face value at maturity or at its liquidation value — what it would actually cost to extinguish today — whichever is higher. 15 The article's argument was that a falling interest-rate structure raises the liquidation value of fixed long-duration obligations, producing a real economic loss that nothing requires anyone to record, and that the reverse should hold when the structure rises.
Apply that to an American household.
A borrower holding a thirty-year mortgage at 3.2 percent in a market where the prevailing rate is 6.66 percent holds a liability whose cost of extinguishment has fallen substantially. Retiring that obligation early means surrendering a below-market financing stream that cannot be replaced. In Fekete's terms, the liquidation value of the liability has declined, and the household has experienced a real economic gain.
No statement records it. No household balance sheet exists on which it could appear. There is no line item for "value of below-market financing retained."
But the household behaves as though it does.
The Federal Housing Finance Agency's National Mortgage Database puts the share of outstanding American mortgages carrying a rate below 4 percent at roughly half — 19.2 percent below 3 percent and a further 29.9 percent between 3 and 3.99 percent as of the second quarter of 2026. 16 The prevailing thirty-year rate in the same period was 6.66 percent. 17
The FHFA has also quantified what that gap does to transaction volume. Its researchers estimate the lock-in effect prevented approximately 1.72 million home sales between 2022 and 2024. 16 Holders of below-market rates will not sell, because selling means surrendering the rate.
The framework's claim, stated as its contribution to this subject: the lock-in effect is Fekete's Law of Liabilities being priced by millions of households, in aggregate, correctly, and with no accounting standard requiring any of them to record it.
A homeowner who declines to sell because he would lose his 3 percent mortgage is performing exactly the calculation Fekete argued accounting omits. He is valuing his liability at its liquidation cost rather than at its face amount, and he is acting on the difference. He has not read Fekete. He does not need to.
Article 45 of this catalog identified ASC 715 — the standard requiring pension obligations to be discounted at current market rates — as the single domain where the Law of Liabilities is codified. This essay identifies a second, informal instance: American household behavior at scale, visible as 1.72 million sales that did not happen, driven by a quantity that appears in no ledger.
And it carries the symmetric implication for Canada. The Canadian borrower receives no such gain, because his liability was never long. The rising rate structure that quietly enriched the American fixed-rate holder simply arrives at the Canadian renewal table as a larger payment.
Menger, and what a court-ordered sale is
The second framework tool is Menger's, and it names what the Canadian data is actually measuring.
Menger's account of money rests on Absatzfähigkeit — saleability, the degree to which a good can be disposed of without loss. 18 This catalog has used it as a continuous measure applicable to any asset, and Articles 17 and 18 applied it to metropolitan housing markets specifically.
"Fifty listings for every buyer" is not a price statement. It is a saleability statement, and it describes a market in which the ordinary mechanism of disposal has stopped functioning at prevailing asking prices.
A court-ordered sale is the terminal point of that decay. The owner cannot dispose of the asset at a price that discharges the obligation against it. So the disposal is performed by a court, on a timetable the owner does not set, at a price he does not negotiate.
Article 44 of this catalog established the three conditions producing the forced-sale discount — leverage, an asset that cannot be liquidated at will, and an unavoidable liquidity need. A foreclosure proceeding is all three, made legally explicit. The framework noted in that article that the forced-sale discount arises not from the asset but from the holder's circumstances at the moment of transaction. A court-ordered sale is the circumstance in its purest available form.
Article 7 of this catalog argued that housing functions as anti-money — the least saleable major asset class, held by households as though it were a store of value. The Vancouver data is that argument reaching its conclusion in a specific jurisdiction, with a specific legal instrument attached.
What to watch
Canadian court-ordered listings through 2027. Given the roughly twelve-month lag from first delinquency to listing, the figures published through 2026 reflect 2025 stress. The renewal wave has been described as early. The 2027 figures are the ones that test whether this is a cycle or a peak.
Whether the American FHA-to-conventional ratio widens. The six-to-one gap is the cleanest available measure of whether American stress remains confined to thin-equity borrowers. A narrowing gap caused by conventional delinquencies rising would indicate the stress is spreading beyond the group the fixed-rate structure cannot protect.
American inventory. If the lock-in explanation is correct, inventory should remain suppressed while the rate gap persists and should normalize as it closes. A sustained inventory recovery without a meaningful decline in the prevailing rate would weaken the argument made here.
Canadian renewal volumes and payment deltas. The mechanism is specific and measurable. Published data on the share of renewing borrowers facing increases above a given threshold is the most direct test available.
What would falsify this
If Canadian stress migrates back down-market. The up-market concentration is the central evidence that this is a rate-structure event rather than a credit event. A shift toward the inexpensive periphery would indicate that ordinary credit deterioration is now the driver and that the term-structure argument is incomplete.
If American conventional delinquency rises to approach FHA levels. That would indicate the fixed-rate structure is not providing the insulation this essay attributes to it, and the explanation for the divergence would have to be sought elsewhere.
If the lock-in effect dissipates without a rate decline. The framework's reading of lock-in as households pricing the liquidation value of their liabilities predicts that the behavior persists as long as the rate gap does. If inventory normalizes while the gap remains wide, households are responding to something else.
The framework notes what would not falsify it: further Canadian price declines or further American foreclosure increases. Both are consistent with the argument and neither distinguishes it from alternatives.
The framework's reading
Two housing markets, the same rising interest-rate structure, and stress that sorts by entirely different variables in each.
In Canada it follows the balance, because the liability reprices and the increase scales with the amount owed regardless of who owes it. In the United States it follows the equity, because the liability does not reprice and only those who were marginal at the outset are reached.
The catalog has argued across its housing work that housing is the least saleable major asset held as though it were a store of value, and across its rate-structure work that the accounting treatment of liabilities conceals real economic change in both directions. The Vancouver court-ordered listings and the American inventory shortfall are the same phenomenon observed from opposite sides.
One set of households is being forced to sell by a liability that grew. The other set is refusing to sell because of a liability that shrank — and neither change appears anywhere except in behavior.
Sources
A note on the lock-in argument. The claim that the lock-in effect constitutes households pricing the liquidation value of their liabilities is the framework's own interpretation of a well-documented behavior, not a finding reported in the housing literature. The behavior and the inventory shortfall are established; the reading of them through the Law of Liabilities is this catalog's contribution and should be weighed as such. The falsification section states what would count against it.
Framework cross-references. Article 7 (housing as anti-money); Articles 17 and 18 (metropolitan saleability mapping and the dynamics of a saleability collapse); Article 41 (the Law of Liabilities, the accounting asymmetry, and the post-2022 rate reversal); Article 44 (the three conditions producing the forced-sale discount); Article 45 (ASC 715 as the sole codified implementation of the Law of Liabilities).
Footnotes
-
"Court-ordered home sales hit a 10-year high in B.C. — and Ontario mortgage delinquencies jumped 52%." Money.ca, October 2026. https://money.ca/mortgages/homebuying/court-ordered-home-sales-bc-ontario-mortgage-delinquencies — Source for the 946 court-ordered property listings across Greater Vancouver and the Fraser Valley between January and September 2026, citing CBC News; and for Equifax Canada's finding that Ontario's mortgage balance delinquency rate rose from 0.24 percent in the first quarter of 2025 to 0.36 percent in the first quarter of 2026. ↩ ↩2
-
"B.C. foreclosures rising as higher mortgage payments kick in." Business in Vancouver. https://www.biv.com/news/real-estate/bc-foreclosures-rising-as-higher-mortgage-payments-kick-in-11570937 — Source for the Zealty.ca figures of 119 court-ordered properties in the Vancouver region in October 2025 against 66 in October 2024 and 28 in October 2023; for Dan Wurtele's observation that foreclosures take upwards of twelve months from first delinquency to listing; for Adam Major's statement that "we are only at the beginning of the big mortgage renewal wave"; and for the Canada Mortgage and Housing Corporation third-quarter figures of 0.18 percent of mortgage accounts and 0.21 percent of mortgage dollars more than 90 days delinquent. ↩ ↩2 ↩3
-
"Lower Mainland Court-Ordered Home Listings Rise Sharply as Mortgage Pressure Builds." VREG, 2026. https://vreg.ca/lower-mainland-court-ordered-home-listings/ — Source for Zealty's report of 773 court-ordered listings in 2025 across the Greater Vancouver and Fraser Valley board regions, approximately three times the annual average between 2017 and 2022; for 845 such listings in the first eight months of 2026; and for the observation that foreclosures constitute the majority of court-ordered listings, which also include bankruptcies and family-law proceedings. ↩ ↩2 ↩3
-
Hamidreza Etebarian, president of Zealty, quoted in "'Big trouble': Vancouver's increasing real estate foreclosures indicate a disturbing economy," 14 September 2026, under the section heading "Foreclosures have 'shifted up-market'." Source for Etebarian's statements that "There is a big difference between this crisis and the previous one" and that "Back in the day, we wouldn't really see any properties in West Van, or Vancouver West Side, expensive properties being foreclosed"; for his account of the 2008 pattern appearing in relatively affordable parts of the region such as the Fraser Valley and the Tri-Cities, often when middle-class homeowners fell on hard times; and for the projection that 2026 could exceed 1,200 court-ordered listings if the pace of the first eight months continues. Two qualifications a reader should carry: the underlying listing data is Zealty's own, so the company is both the source and the subject of the comparison; and the piece circulated through syndication, so the originating publication could not be established. The direction Etebarian describes is corroborated by the regional totals at 1, 2 and 3, which are independently sourced. ↩ ↩2 ↩3
-
WOWA.ca, "Vancouver Housing Market Report," data for September 2026. https://wowa.ca/vancouver-housing-market — Source for the Metro Vancouver benchmark price of $1,075,900 (down 5.5 percent year over year), detached benchmark of $1,784,700 (down 7.3 percent), townhouse benchmark of $1,016,700 (down 4.7 percent), apartment benchmark of $682,500 (down 6.2 percent), 1,717 sales in September 2026 (down 8.4 percent), and 16,394 active listings. Also the source for the observation that the Vancouver benchmark has risen 9.7 percent over ten years against approximately 32 percent inflation over the same period. ↩
-
"'Heavy distractions' stalling Greater Vancouver housing market: report." Yahoo News Canada, October 2026. https://ca.news.yahoo.com/heavy-distractions-stalling-greater-vancouver-235642649.html — Source for the Royal LePage finding that the aggregate price of a Greater Vancouver home decreased 4 percent year over year to $1.1 million in the third quarter of 2026, for transaction volumes running 25 to 30 percent below the ten-year average, and for Randy Ryalls's comparison: "If 2021 felt like there were 50 buyers for every home listed in Vancouver… now you have 50 listings for every buyer." ↩ ↩2
-
WOWA.ca, "Canadian Housing Market Report," data for September 2026. https://wowa.ca/reports/canada-housing-market — Source for the characterization of September 2026 as a renewed setback, for both national average and benchmark prices falling below year-earlier levels, for new listings falling 1.8 percent and the national sales-to-new-listings ratio easing to 48.8 percent, and for British Columbia benchmark prices down 4.7 percent year over year. ↩
-
Equifax Canada, Market Pulse Quarterly Consumer Credit Trends Report. https://www.equifax.ca/en/newsroom/market-pulse-consumer-credit-trends-report/ — For the figure of approximately one million Canadian mortgages due for renewal from the low-interest-rate originations of 2020, and for the finding that a quarter of mortgage holders saw monthly payments increase by more than $150 at renewal in the fourth quarter of 2024. ↩
-
Equifax Canada (as 8) and Business in Vancouver (as 2) — For the renewal-shock mechanism and its magnitude at the individual level. Reported payment increases on second renewals in the Vancouver region have been described in the range of several hundred to roughly a thousand dollars a month; the framework states the range rather than a single household figure, since the published accounts are individual profiles rather than survey data. ↩
-
"Mortgage performance steady in May as calendar drives delinquency bump." HousingWire, 2026. https://www.housingwire.com/articles/ice-may-2026-mortgage-performance-delinquencies-foreclosures/ — Source for the ICE First Look report showing the national delinquency rate at 3.50 percent in May 2026, serious delinquencies up 111,000 year over year, and active foreclosure inventory rising to 280,000 loans, up 34 percent year over year for the highest level in six years, with the pre-sale foreclosure inventory rate at 0.51 percent and still below pre-pandemic norms. ↩
-
Cotality. "U.S. foreclosure rate reaches six-year high." 2026. https://www.cotality.com/press-releases/u-s-foreclosure-rate-reaches-six-year-high — Source for the national foreclosure inventory rate rising to 0.4 percent in March 2026, the highest in six years and the first increase in more than a year; for foreclosure increases appearing in 77 percent of United States metros; for the overall delinquency share of 3 percent, up 0.2 percentage points year over year; for serious delinquency at 1.2 percent against 1 percent in March 2025; and for 40 states recording year-over-year increases in overall delinquency. ↩
-
ATTOM Data Solutions, Midyear 2026 U.S. Foreclosure Market Report. https://www.attomdata.com/news/ — For foreclosure filings up 15.0 percent year over year in the second quarter of 2026. On the FHA seriously delinquent rate of 2.06 percent, up 3 basis points from the prior quarter and 49 basis points year over year, see the Mortgage Bankers Association survey at 13 and the summary in "Mortgage Delinquencies Ease, But FHA Distress Keeps Deepening," National Mortgage Professional, https://nationalmortgageprofessional.com/news/mortgage-delinquencies-ease-fha-distress-keeps-deepening ↩ ↩2
-
Mortgage Bankers Association. "Mortgage Delinquencies Decrease Slightly in the Second Quarter of 2026." National Delinquency Survey, August 13, 2026. https://www.mba.org/news-and-research/newsroom/news/2026/08/13/mortgage-delinquencies-decrease-slightly-in-the-second-quarter-of-2026 — Source for the overall delinquency rate of 4.37 percent, down 7 basis points from the first quarter and up 44 basis points year over year; for the foreclosure inventory rate increasing almost 20 basis points year over year; and for the year-over-year delinquency increases of 12 basis points for conventional loans, 122 basis points for FHA loans, and 57 basis points for VA loans. ↩ ↩2 ↩3 ↩4
-
Board of Governors of the Federal Reserve System, Delinquency Rate on Single-Family Residential Mortgages, Booked in Domestic Offices, All Commercial Banks [DRSFRMACBS]. https://fred.stlouisfed.org/series/DRSFRMACBS — The bank-booked series runs materially below the Mortgage Bankers Association figures because it covers only loans retained on commercial bank balance sheets rather than the whole servicing universe. The comparison in the text is drawn within the MBA survey at 13 for that reason; the two series are not interchangeable and a ratio taken across them overstates the gap. ↩
-
Fekete, Antal E. Monetary Economics 102: Gold and Interest, Lecture 12, "Accounting Under a Falling Interest-Rate Structure." https://professorfekete.com/articles/AEFMonEcon102Lecture12.pdf — The argument that a falling interest-rate structure destroys capital through an asymmetry between the accounting treatment of assets and liabilities, developed at length in Article 41 of this catalog. ↩
-
Federal Housing Finance Agency, National Mortgage Database, quarterly outstanding-rate distribution. https://www.fhfa.gov/data/national-mortgage-database — For the second quarter of 2026, 19.2 percent of outstanding mortgages carried a rate below 3 percent and a further 29.9 percent between 3 and 3.99 percent, placing roughly half the stock below 4 percent. See the quarterly summaries at https://calculatedrisk.substack.com/p/fhfas-q4-national-mortgage-database — FHFA research separately estimates that the lock-in effect prevented approximately 1.72 million home sales between 2022 and 2024. ↩ ↩2
-
Freddie Mac, Primary Mortgage Market Survey, week of 27 August 2026. https://freddiemac.gcs-web.com/news-releases/news-release-details/mortgage-rates-average-666 — The thirty-year fixed-rate mortgage averaged 6.66 percent, against 6.65 percent the prior week; the fifteen-year averaged 5.98 percent. Sam Khater, Freddie Mac chief economist: "Mortgage rates changed little this week averaging 6.66%." ↩
-
Menger, Carl. "On the Origins of Money." Economic Journal, Vol. 2 (1892), pp. 239–255. Translated by Caroline A. Foley. https://mises.org/library/book/origins-money — The concept of Absatzfähigkeit, saleability, as the degree to which a good can be disposed of without loss. ↩
Related essays
The Saleability Audit of Bitcoin: What Menger Would Say in 2026
Bitcoin maximalists insist Bitcoin is the most saleable monetary good ever created. Skeptics insist it doesn't work for the African villager or the rural Chinese citizen the maximalists invoke. Both positions miss what Menger's framework actually says when applied carefully. The audit produces uncomfortable results in both directions — Bitcoin scores remarkably well on some criteria and remarkably poorly on others — and the actual ground-truth of crypto adoption in emerging markets in 2026 is something neither camp accurately describes.
The Decay Function of Marketability: Toward a Computable Menger-Fekete Framework
Menger argued that saleability is a spectrum; Fekete developed the gold basis to measure it for one commodity. This essay proposes a generalizable decay function of marketability, measurable across every modern financial instrument, that renders Menger's core insight computable for the first time.
The Paper Substitute: Agency Mortgage-Backed Securities and the Next Saleability Crisis
Fannie Mae and Freddie Mac issue $9 trillion in paper claims on an asset class — single-family housing — that has the worst saleability characteristics of any major investment available to American households. This is precisely the structure Fekete identified as the most fragile in any monetary system: a deep, liquid market in paper substitutes for an underlying that cannot itself be substituted. The 2008 collapse was the first observable failure of this architecture. The next will be larger.