
Researched and drafted with AI assistance · reviewed and edited by Jason D. Keys
The saver's problem
The individual saver in 2026 confronts a structural problem that the pre-1971 saver did not confront in the same form and that most contemporary financial advice does not seriously engage. The unit of account in which the saver's income is denominated, in which the saver's expenses are priced, in which the saver's tax obligations are calculated, in which the saver's retirement accounts are valued, and in which the saver's estate will eventually be transferred — that unit of account itself depreciates. Not occasionally, not during crises, not as an anomaly to be corrected by prudent monetary policy — continuously, structurally, as a designed feature of the post-Bretton Woods institutional architecture. The Federal Reserve's stated target for annual inflation is 2 percent. 1 Two percent per year for a saving lifetime of forty years is a cumulative purchasing-power decline of approximately 55 percent, at the stated target. Actual inflation across the 1971-2026 window has averaged closer to 4 percent, cumulating to a purchasing-power decline of approximately 85 percent. 2 Actual purchasing-power inflation across the specific 2020-2026 window this catalog has focused on has run substantially higher than the reported CPI figures, as documented in Article 20 and referenced throughout the Watching the Cracks series.
The pre-1971 saver operated under a different institutional architecture. From 1879 through 1914, the U.S. dollar was convertible into a specific weight of gold: 25.8 grains, nine-tenths fine. 3 The weight traces to the Coinage Acts of 1834 and 1837, which fixed the standard weight at 258 grains and the fineness at nine hundred thousandths; the Coinage Act of 1873 demonetized the standard silver dollar rather than defining the gold dollar; and the definition was formally codified in the Gold Standard Act of 1900. A dollar held in cash, or a dollar deposited in a demand-payable bank account, could be exchanged at par for that specific weight of gold on demand. The general price level fluctuated year-to-year but exhibited no long-term trend of decline in monetary purchasing power. A saver accumulating cash across the classical gold-standard decades — 1890 to 1914, say — experienced no systemic inflation loss: the price level fluctuated but the cumulative purchasing-power change across those years was near zero. The framework has to be careful about how far it extends that claim, and had previously extended it too far, running the example to 1930. It does not survive the First World War. 4 Consumer prices rose roughly seventy percent between 1913 and 1929, so a dollar saved in 1890 had lost something on the order of forty to forty-five percent of its purchasing power by 1930. What the pre-1914 record establishes is narrower and still sufficient for the contrast this essay draws: under the classical architecture the unit of account held its value across decades, and the mechanism that ended that was the financing of the war rather than any gradual erosion. The saving strategy under those conditions was mechanically simple: work, save cash or gold-convertible deposits, deploy the accumulated savings in retirement. The unit of account did the store-of-value work automatically because the underlying monetary architecture was sound.
The saver in 2026 does not have that architecture. The Golden Triangle that Article 33 of this catalog described — real bills for short-term trade credit, gold coin for the monetary substrate, savings-financed long-term capital formation — has been absent for more than a full working lifetime. Everyone currently alive has spent their entire economic life operating within the substitute-layer environment that emerged after August 15, 1971. The tools available for personal savings are all substitute-layer instruments: bank deposits (claims on fractional-reserve banks that hold sovereign debt as reserves), money market funds (claims on short-term paper instruments), bonds (long-term claims on future currency payments in a depreciating unit), stocks (claims on future corporate earnings denominated in a depreciating unit), mutual funds and ETFs (aggregated claims on the above), real estate (claims on housing services and land, with monetary purchasing-power exposure indirect and imperfect), and precious metals (the historical form of money, whose contemporary function is complicated by the derivative-market apparatus documented in Articles 33 and 34).
This essay is the framework applied to the individual saver's question of how to navigate this environment. It addresses the mechanics of 401(k) plans as the dominant tax-advantaged savings vehicle for most American workers; the Rule of 72 and its critical inflation application; the personal-experience insight that comes from viewing the mutual fund industry from inside; the case for the self-directed Solo 401(k) structure available to the self-employed and to those with 1099 income; the framework's reading of hard-asset diversification; the technical trading approach articulated by Chris Vermeulen in his Asset Revesting framework and how it fits within the framework's broader analytical apparatus; and the framework's synthesis of principles for personal savings navigation under substrate conditions that will likely persist for the remainder of most current savers' working lives.
Before proceeding, an explicit caveat that will be restated in the closing: this essay is not investment advice. The framework offers analytical tools and observations about specific institutional structures. Every individual saver faces specific circumstances — income, tax situation, family obligations, risk tolerance, time horizon, existing account balances, employer plan options, geographic location, professional status — that the framework cannot assess and does not attempt to assess. What the framework offers is the analytical apparatus through which specific individual decisions can be evaluated with clearer premises. The application of that apparatus to any specific person's specific decisions must be done by that person, ideally in consultation with qualified professionals whose responsibilities and expertise the framework does not attempt to replace.
Human capital as the dominant asset
Before addressing any specific institutional structure, the framework corrects a sequencing error implicit in most personal-finance discussion: portfolio allocation is treated as the primary lever available to a saver, when for most savers in the first two decades of a working life it is not. The dominant asset available to a twenty-five-year-old with thirty-five years of working life ahead is not any combination of 401(k) balance, brokerage account, or physical metal. It is earning power — the capitalized value of the saver's future labor income, conditioned on skill, scarcity, and adaptability.
The classical economic tradition this catalog has engaged since Article 1 treats labor as a factor of production standing alongside land and capital; Article 31's engagement with the machinery question examined what happens to labor's claim on output as capital substitutes for it. What that analysis did not fully carry into this essay's original treatment of personal savings is the asset-side implication: human capital has specific properties that no financial instrument, however constructed, can replicate. It cannot be confiscated by executive order in the way physical gold was confiscated in 1933. It cannot be inflated away in the way currency-denominated claims are inflated away, because wages — with a lag, and imperfectly, but nonetheless — adjust to price levels in ways that fixed-coupon bonds do not. It cannot be rehypothecated, cannot be trapped behind a custodian, and cannot be frozen by a court order attaching a specific account. It travels with the saver across state lines and national borders in a way no domestically-titled asset does. And for a saver with a genuinely scarce and current skill, it compounds — through raises, through promotions, through the ability to start an enterprise that itself becomes a productive asset — in a way that is not obviously worse, and is arguably more robust, than the compounding available from any portfolio allocation this essay goes on to discuss.
The practical implication for sequencing. For a saver still early in a working life with thirty or more years of expected labor income remaining, the highest-return, most robust allocation decision available is very often not a reallocation within the financial portfolio at all. It is continued, disproportionate investment in the scarcity and currency of the saver's own skills — the credential, the specific technical capability, the professional network, the demonstrated track record — because that asset dominates the financial portfolio in expected value for most of the accumulation period, and is structurally immune to several of the specific risks (confiscation, inflation, custodial failure) this essay spends the remainder of its length analyzing. The principles for portfolio allocation that follow in the sections below should be read as governing the secondary question — what to do with savings after labor income has been secured and stabilized — rather than the primary one.
This does not mean the portfolio question is unimportant; it means it is not first. A saver who optimizes 401(k) allocation with great precision while neglecting the skill-currency and income-scarcity that generate the contributions in the first place has the framework's priorities backward. The sections that follow proceed on the assumption that the saver has already made reasonable decisions about the primary asset, and address the secondary question of what to do with the resulting savings.
The 401(k) as institutional artifact
The 401(k) is the dominant tax-advantaged savings vehicle available to most American employees in 2026. Understanding what it actually is — as opposed to how it is marketed — is the starting point for any framework analysis of personal savings.
The mechanical facts for 2026. The employee contribution limit for 2026 is $24,500, up from $23,500 in 2025. 5 Additional catch-up contributions are available for older workers: $8,000 for ages 50-59 and 64 or older, and $11,250 (the "super catch-up") for ages 60-63 under a SECURE 2.0 Act provision. 5 The combined employer-plus-employee contribution limit for 2026 is $72,000, or $80,000 with the standard catch-up, or $83,250 with the super catch-up. 5 Beginning in 2026, employees earning more than $150,000 in the prior year (indexed for inflation) must make any catch-up contributions to a Roth 401(k) rather than a traditional pre-tax 401(k), under a SECURE 2.0 provision that has generated significant compliance complexity for plan sponsors and administrators. 6
The institutional structure. A 401(k) plan is sponsored by an employer, administered by a plan administrator (typically a large financial institution such as Fidelity, Vanguard, T. Rowe Price, or Empower), custodied by a plan trustee, and populated by a menu of investment options chosen by the employer and the plan administrator. The employee has three principal decisions: whether to contribute at all, how much to contribute up to the statutory limit, and how to allocate contributions across the available investment menu. The employer typically offers a matching contribution, which is structured to encourage employee participation and to provide the employer with a tax-deductible business expense.
The tax mechanics for the employer. This is where the framework analysis needs to be precise. Employer matching contributions are deductible business expenses under IRC Section 404. The employer records the match as compensation expense, which reduces the employer's taxable income dollar-for-dollar. If the employer is a C corporation subject to the 21 percent federal corporate income tax rate, each $1 of employer match reduces the employer's federal tax liability by $0.21. 7 State income tax adds additional deductibility depending on jurisdiction. The employer therefore captures approximately 21-30 cents of tax offset per dollar of match, depending on state. The "cost" of the match to the employer is meaningfully less than the nominal dollar amount contributed.
The tax mechanics for the employee. Traditional pre-tax employee contributions reduce the employee's current-year taxable income at the employee's marginal federal tax rate (which for most workers is 12-24 percent) plus applicable state tax. 7 Employer matching contributions to a traditional 401(k) are not taxable to the employee at the time of contribution — they accumulate tax-deferred within the account. Both the employee's contributions and the employer's matching contributions grow tax-deferred until withdrawal, typically after age 59½, at which point withdrawals are taxed as ordinary income to the employee.
The lock-up. This is the framework's first analytical intervention. The 401(k) structure imposes a lock-up on contributed funds until age 59½. Early withdrawals are subject to a 10 percent penalty in addition to ordinary income tax, with narrow exceptions for hardship, disability, and certain qualifying events. 8 For a twenty-five-year-old contributing to a 401(k), the lock-up is thirty-four years. For a thirty-five-year-old, twenty-four years. For a forty-five-year-old, fourteen years. During that lock-up period, the tax code, contribution limits, required minimum distribution rules, permitted investment options, and account custody arrangements can all change — and have changed materially over the past forty years. The saver is committing capital to a regulatory regime whose future terms are not knowable at the time of contribution.
The employer's incentive structure. The framework's second analytical intervention. From the employer's perspective, the 401(k) match is not a gift to employees; it is a component of total compensation structured for maximum tax efficiency for the employer, maximum retention effect (through vesting schedules), and maximum administrative simplicity (through outsourced plan administration). The employer benefits directly through the tax deduction. The plan administrator benefits through recurring management and administrative fees. The mutual fund families whose funds populate the investment menu benefit through management fees on the accumulated assets under management. The employee benefits from tax-deferred growth and the nominal dollar value of the match — but the employee is the third-order beneficiary of a structure whose primary economic benefits flow to the sponsoring employer, the administrator, and the fund families.
The industry's aggregate scale. As of the end of 2025, U.S. 401(k) plan assets totaled approximately $10.1 trillion across roughly 70 million active participants and about 730,000 plans, on Investment Company Institute figures. 9 Fees on that base are harder to pin than the asset total, and the figure here is derived rather than sourced: applying an all-in cost of 0.7 to 1.1 percent would imply roughly $70-110 billion a year, but asset-weighted average costs are materially lower than that range for large plans and higher for small ones, so the derived total should be read as an order of magnitude rather than a measurement. The 401(k) system is a massive institutional apparatus whose stakeholders include employers, administrators, fund families, and financial-services firms, in addition to the employees whose retirement savings notionally the system serves.
The framework's reading. The 401(k) is a specific institutional artifact designed under specific historical and political conditions to serve multiple stakeholders simultaneously. Its value to any individual employee depends on the specific terms of that employee's plan, the specific investment options available, the specific tax situation of that employee, and the specific time horizon and life circumstances of that employee. The framework does not argue that the 401(k) is universally bad or universally good. It argues that the 401(k) should be evaluated as a specific instrument with specific costs and benefits, not as a default that all workers should maximize regardless of individual circumstances.
The wrapper is a substitute-layer instrument too
The preceding section examined the 401(k) as an institutional artifact with specific stakeholders and specific incentive structures. This section presses one step further, because the framework's own logic — developed at length in the housing section below, and in Article 8's original treatment of housing as "anti-money" — implies a conclusion about the 401(k) itself that the framework had not, until this revision, stated explicitly: the 401(k) wrapper is a substitute-layer instrument in exactly the framework's technical sense, independent of what assets are held inside it.
Consider what a 401(k) balance actually is, stripped of its marketing description as "your retirement savings." It is a claim on future political permission to withdraw funds, at a future tax rate that current law does not fix, under a future set of rules that a future Congress, a future Treasury, and a future set of plan-administration regulations will write. The saver does not own gold, or an index fund, or a bond in the ordinary property sense when that asset sits inside a 401(k); the saver owns a contractual and statutory right to eventually direct the custodian to distribute value, subject to conditions that can and have changed. This is precisely the same category of claim the framework applies to housing later in this essay — a claim with counterparty layers, political contingency, and liquidation friction — and the same disqualifying logic applies.
Counterparty layers. A typical 401(k) holding a mutual fund or ETF involves, at minimum, four distinct institutional counterparties standing between the saver and the underlying asset: the plan administrator (who manages the account and enforces plan rules), the plan trustee (who holds legal title to plan assets), the custodian bank (who holds the actual securities), and the fund sponsor (who manages the underlying mutual fund or ETF and who in turn typically uses its own sub-custodian for physical assets, particularly relevant for commodity-backed ETFs). Each layer is a point of operational risk, fee extraction, and — in a genuine substrate-condition failure of the kind Article 16 has documented — potential delay or dispute in a moment when the saver most needs access.
Political contingency. The specific terms governing 401(k) withdrawal — the age at which withdrawals become penalty-free, the required minimum distribution age and formula, the tax treatment of withdrawals, the treatment of Roth versus traditional balances — have changed materially within the working lifetime of every current saver, and there is no structural reason to expect them not to continue changing. The SECURE Act of 2019 raised the RMD age from 70½ to 72. SECURE 2.0 in 2022 raised it again, to 73 and eventually 75, and introduced the Roth-mandatory catch-up provision for high earners that took effect in 2026 and that this essay's earlier section on 401(k) mechanics documented. Proposals to further "Rothify" retirement contributions — eliminating the pre-tax deduction in exchange for tax-free withdrawal, which would represent a one-time acceleration of tax revenue attractive to any Congress facing a deficit — have circulated repeatedly. Proposals for wealth taxes or surtaxes on large retirement account balances have likewise been introduced, though not enacted, across multiple legislative sessions. None of these specific proposals may become law. The framework's point is not that any specific change is coming; it is that the wrapper's terms are set by an ongoing political process the saver does not control, in exactly the way the framework treats as disqualifying when it examines currency, housing regulation, or the Federal Reserve's own discretionary authority elsewhere in this catalog.
Liquidation friction. Age gates, the 10 percent early-withdrawal penalty, required minimum distributions that can force taxable events at an inopportune point in the market cycle, and administrative delays in processing distributions all impose friction between the saver's need for the asset and the asset's actual availability. This is the identical liquidation-friction category the framework applies to housing's 30-90 day transaction timeline later in this essay — a different mechanism, a comparable structural effect.
The Custody Depth score. To make this dimension concrete and comparable across instruments, the framework introduces a simple ordinal measure: the number of distinct institutional counterparties standing between the saver and direct, unencumbered control of the underlying asset. A lower score indicates less intermediation and less exposure to the specific risks this section has outlined; a higher score indicates more.
| Score | Example | What stands between the saver and the asset |
|---|---|---|
| 0 | Physical gold coin in the saver's own safe; cash in hand | Nothing. Direct physical possession. |
| 1 | Allocated bullion storage in the saver's name at a specialty vaulting firm; a direct promissory note to a known borrower | A single, specifically-identified custodian holding a specifically-identified asset on the saver's behalf |
| 2 | A brokerage account holding individual stock in street name; a bank deposit | A single institutional intermediary (the broker or the bank) with general, not asset-specific, custody |
| 3 | A mutual fund or ETF held in a taxable brokerage account | The brokerage, plus the fund sponsor, plus the fund's own custodian bank |
| 4 | The same ETF held inside an employer-sponsored 401(k) | The plan administrator, plus the plan trustee, plus the fund sponsor, plus the fund's custodian |
| 5 | A commodity-backed ETF (such as a gold ETF) held inside an employer-sponsored 401(k) | All of the above, plus the ETF's own physical-metal sub-custodian (typically a bullion bank), plus the political and statutory layer — ERISA, the tax code — governing the wrapper itself |
The framework's specific observation: almost no portfolio-tracking tool reports this number, and it is arguably more informative than the asset-class label attached to a given holding. A saver who believes they hold "gold" through a 401(k)-wrapped commodity ETF is, on this measure, five institutional layers removed from the asset whose entire appeal is supposed to be its freedom from counterparty risk. This does not mean the position is worthless or the framework's hard-asset principle (Principle 7, below) is wrong; it means the position should be understood accurately, and it means physical possession or low-custody-depth alternatives capture a meaningfully different risk profile than the same nominal asset class held at maximum custody depth.

The employer match reconsidered under inflation
The conventional advice on the employer match is that it represents "free money" that no employee should decline. The employer will contribute matching dollars to the employee's 401(k) if the employee contributes; therefore the employee should contribute at least enough to capture the full match. This advice is correct in its narrow nominal sense: the employer will indeed contribute matching dollars, and those dollars will indeed appear in the employee's account. The advice becomes more complicated when the framework's analysis of monetary depreciation is applied to the multi-decade lock-up period during which those matching dollars will be held.
Consider a specific example. An employee earns $80,000 per year and contributes 6 percent of salary ($4,800) to a traditional 401(k). The employer matches 100 percent of contributions up to 6 percent of salary — an employer contribution of $4,800. The employee's account receives $9,600 in total contributions in year one. If the employee then holds those contributions in a broadly diversified equity mutual fund earning a nominal 7 percent per year over the subsequent forty years until retirement at age 65, the $9,600 grows to approximately $145,000 by retirement. The employee has captured "free money" in the amount of the employer's $4,800 initial match, which has grown along with the employee's contribution to represent roughly half of the final $145,000 balance.
The framework's analytical intervention: what does that $145,000 buy in retirement, expressed in the purchasing power of the year one dollar? At the Federal Reserve's stated 2 percent inflation target over forty years, the cumulative purchasing-power decline is approximately 55 percent, meaning the $145,000 purchases what approximately $65,000 would have purchased in year one. The nominal balance has grown 15x, but the real purchasing-power has grown approximately 6.8x — from $9,600 initial contribution to $65,000 year-one-equivalent at retirement. The math works out to an approximately 4.9 percent real annual return on the combined contributions, of which roughly 2 percent is attributable to the employer match component.
But this calculation assumes the Federal Reserve achieves its 2 percent target consistently across all forty years. The historical record does not support that assumption. Actual U.S. CPI inflation from 1985 through 2025 (a forty-year window ending at the beginning of the framework's current focus period) averaged approximately 2.85 percent per year. 4 Actual purchasing-power decline across that period, if the framework's Article 20 arguments about CPI understatement are correct, was likely 3.5-4.5 percent per year. Using a 3.5 percent inflation assumption over forty years: the cumulative purchasing-power decline is approximately 75 percent, meaning the $145,000 purchases what approximately $36,000 would have purchased in year one. The real annual return on the combined contributions falls to approximately 3.4 percent, of which the employer match component represents approximately 1.4 percent.
Under a higher-inflation scenario more consistent with the 2020-2026 window this catalog has focused on — actual purchasing-power inflation of 5-6 percent per year — the calculation deteriorates further. At 6 percent actual inflation over forty years, the cumulative purchasing-power decline is approximately 90 percent, meaning the $145,000 purchases what approximately $14,500 would have purchased in year one. The real annual return on the combined contributions collapses to approximately 0.9 percent, of which the employer match component represents essentially none — the entire "free money" character of the match is offset by monetary depreciation.
The framework's reading of the employer match. The nominal value of the match is real. The employer does contribute matching dollars, and those dollars do accumulate in the employee's account. What the framework's analysis reveals is that the real value of the match — its purchasing-power value at the time of eventual withdrawal — depends critically on the inflation regime that prevails during the accumulation period. Under low and stable inflation (the 1990-2019 window), the match adds meaningful real value. Under high and unstable inflation (the 1970s, the 2020-2026 window, and potentially the remainder of the current cycle), the match adds substantially less real value or none at all. The "free money" framing collapses the nominal-real distinction that the framework treats as foundational.
The framework's practical suggestion. For employees whose employers offer matching contributions, capturing the match up to the vested minimum is probably worth doing — the nominal dollars are real dollars, and even if the real value is compressed by inflation, some real value likely remains after tax considerations. What the framework's reading suggests against is the conventional advice to maximize 401(k) contributions beyond the match on the assumption that additional pre-tax contributions represent guaranteed "wins" against future tax liability. The additional pre-tax contributions represent additional dollars locked into the substitute-layer environment for decades under uncertain future tax rules and uncertain future purchasing power. That's a different calculation than capturing the immediate match, and it warrants individual analysis rather than default maximization.
The Rule of 72 as framework tool
The Rule of 72 is a mathematical approximation with a lineage extending to Luca Pacioli's Summa de Arithmetica published in Venice in 1494. The rule provides a mental shortcut for calculating exponential doubling times: the number of periods required for a quantity to double at a given compound growth rate is approximately 72 divided by the growth rate expressed as a percentage. The mathematically exact formula involves natural logarithms — ln(2)/ln(1+r) ≈ 0.693/r for continuous compounding, which is why the alternative "Rule of 70" is sometimes used and why "Rule of 69.3" would be the theoretically precise value for continuous compounding. The number 72 is preferred in practical use because it has many small divisors (2, 3, 4, 6, 8, 9, 12) and provides the best accuracy at the 6-10 percent growth rates that dominate real-world investment and inflation scenarios.
The framework's principal applications of the Rule of 72:
Investment doubling times. At a 6 percent annual return, an investment doubles in approximately 72/6 = 12 years. At 8 percent, 9 years. At 10 percent, 7.2 years. At 12 percent, 6 years. The S&P 500's long-term nominal return has averaged approximately 10 percent per year over the past century; nominal doubling every 7.2 years. The historical U.S. Treasury bond has averaged approximately 5 percent nominal; nominal doubling every 14.4 years. Cash held in a bank account earning 0.5 percent doubles nominally every 144 years — effectively never.
Inflation halving purchasing power. The same mathematics applies to exponential decay. At 3 percent annual inflation, the purchasing power of a fixed dollar amount halves in approximately 72/3 = 24 years. At 6 percent inflation, purchasing power halves in 12 years. At 8 percent inflation, purchasing power halves in 9 years. At 10 percent inflation, purchasing power halves in 7.2 years. During the 2021-2022 window when official CPI approached 8-9 percent, purchasing power was halving in less than a decade — a rate of monetary erosion not seen in the United States since the 1970s.
Real return. The framework's most important application of the Rule of 72: real return equals nominal return minus inflation. If nominal return is 6 percent and inflation is 6 percent, real return is zero. Zero real return means no doubling of purchasing power ever occurs regardless of the holding period. If nominal return is 4 percent and inflation is 6 percent, real return is negative 2 percent. Negative real return means the purchasing power of the invested capital declines even as the nominal balance grows. The Rule of 72 in this application answers the reverse question: at negative 2 percent real return, purchasing power halves in approximately 72/2 = 36 years — the saver's capital is being consumed by the depreciation of the unit of account, not preserved, regardless of the nominal balance shown on the account statement.
The framework's CPI intervention. Article 20 of this catalog documented the framework's reading of the Consumer Price Index calculation methodology, focusing on the substitution biases, hedonic adjustments, and owner's-equivalent-rent treatment that collectively understate the actual purchasing-power inflation experienced by households. If the framework's analysis is correct, then the Rule of 72 applied to reported CPI understates the actual purchasing-power halving time. A saver looking at reported CPI of 3 percent might calculate that purchasing power halves in 24 years and plan accordingly; if actual purchasing-power inflation is 5 percent, purchasing power is halving in 14.4 years, and the saver's plan is proceeding on false premises.
The framework's other rules. The Rule of 72 is the doubling rule. Related approximations: the Rule of 114 for tripling (114/rate = years to triple) and the Rule of 144 for quadrupling. At 8 percent annual return, money triples in approximately 14.3 years and quadruples in 18 years. At 8 percent annual inflation, purchasing power reaches one-third of its initial value in 14.3 years and one-quarter in 18 years — the accumulated erosion is nonlinear and accelerating in its effect on saver behavior.
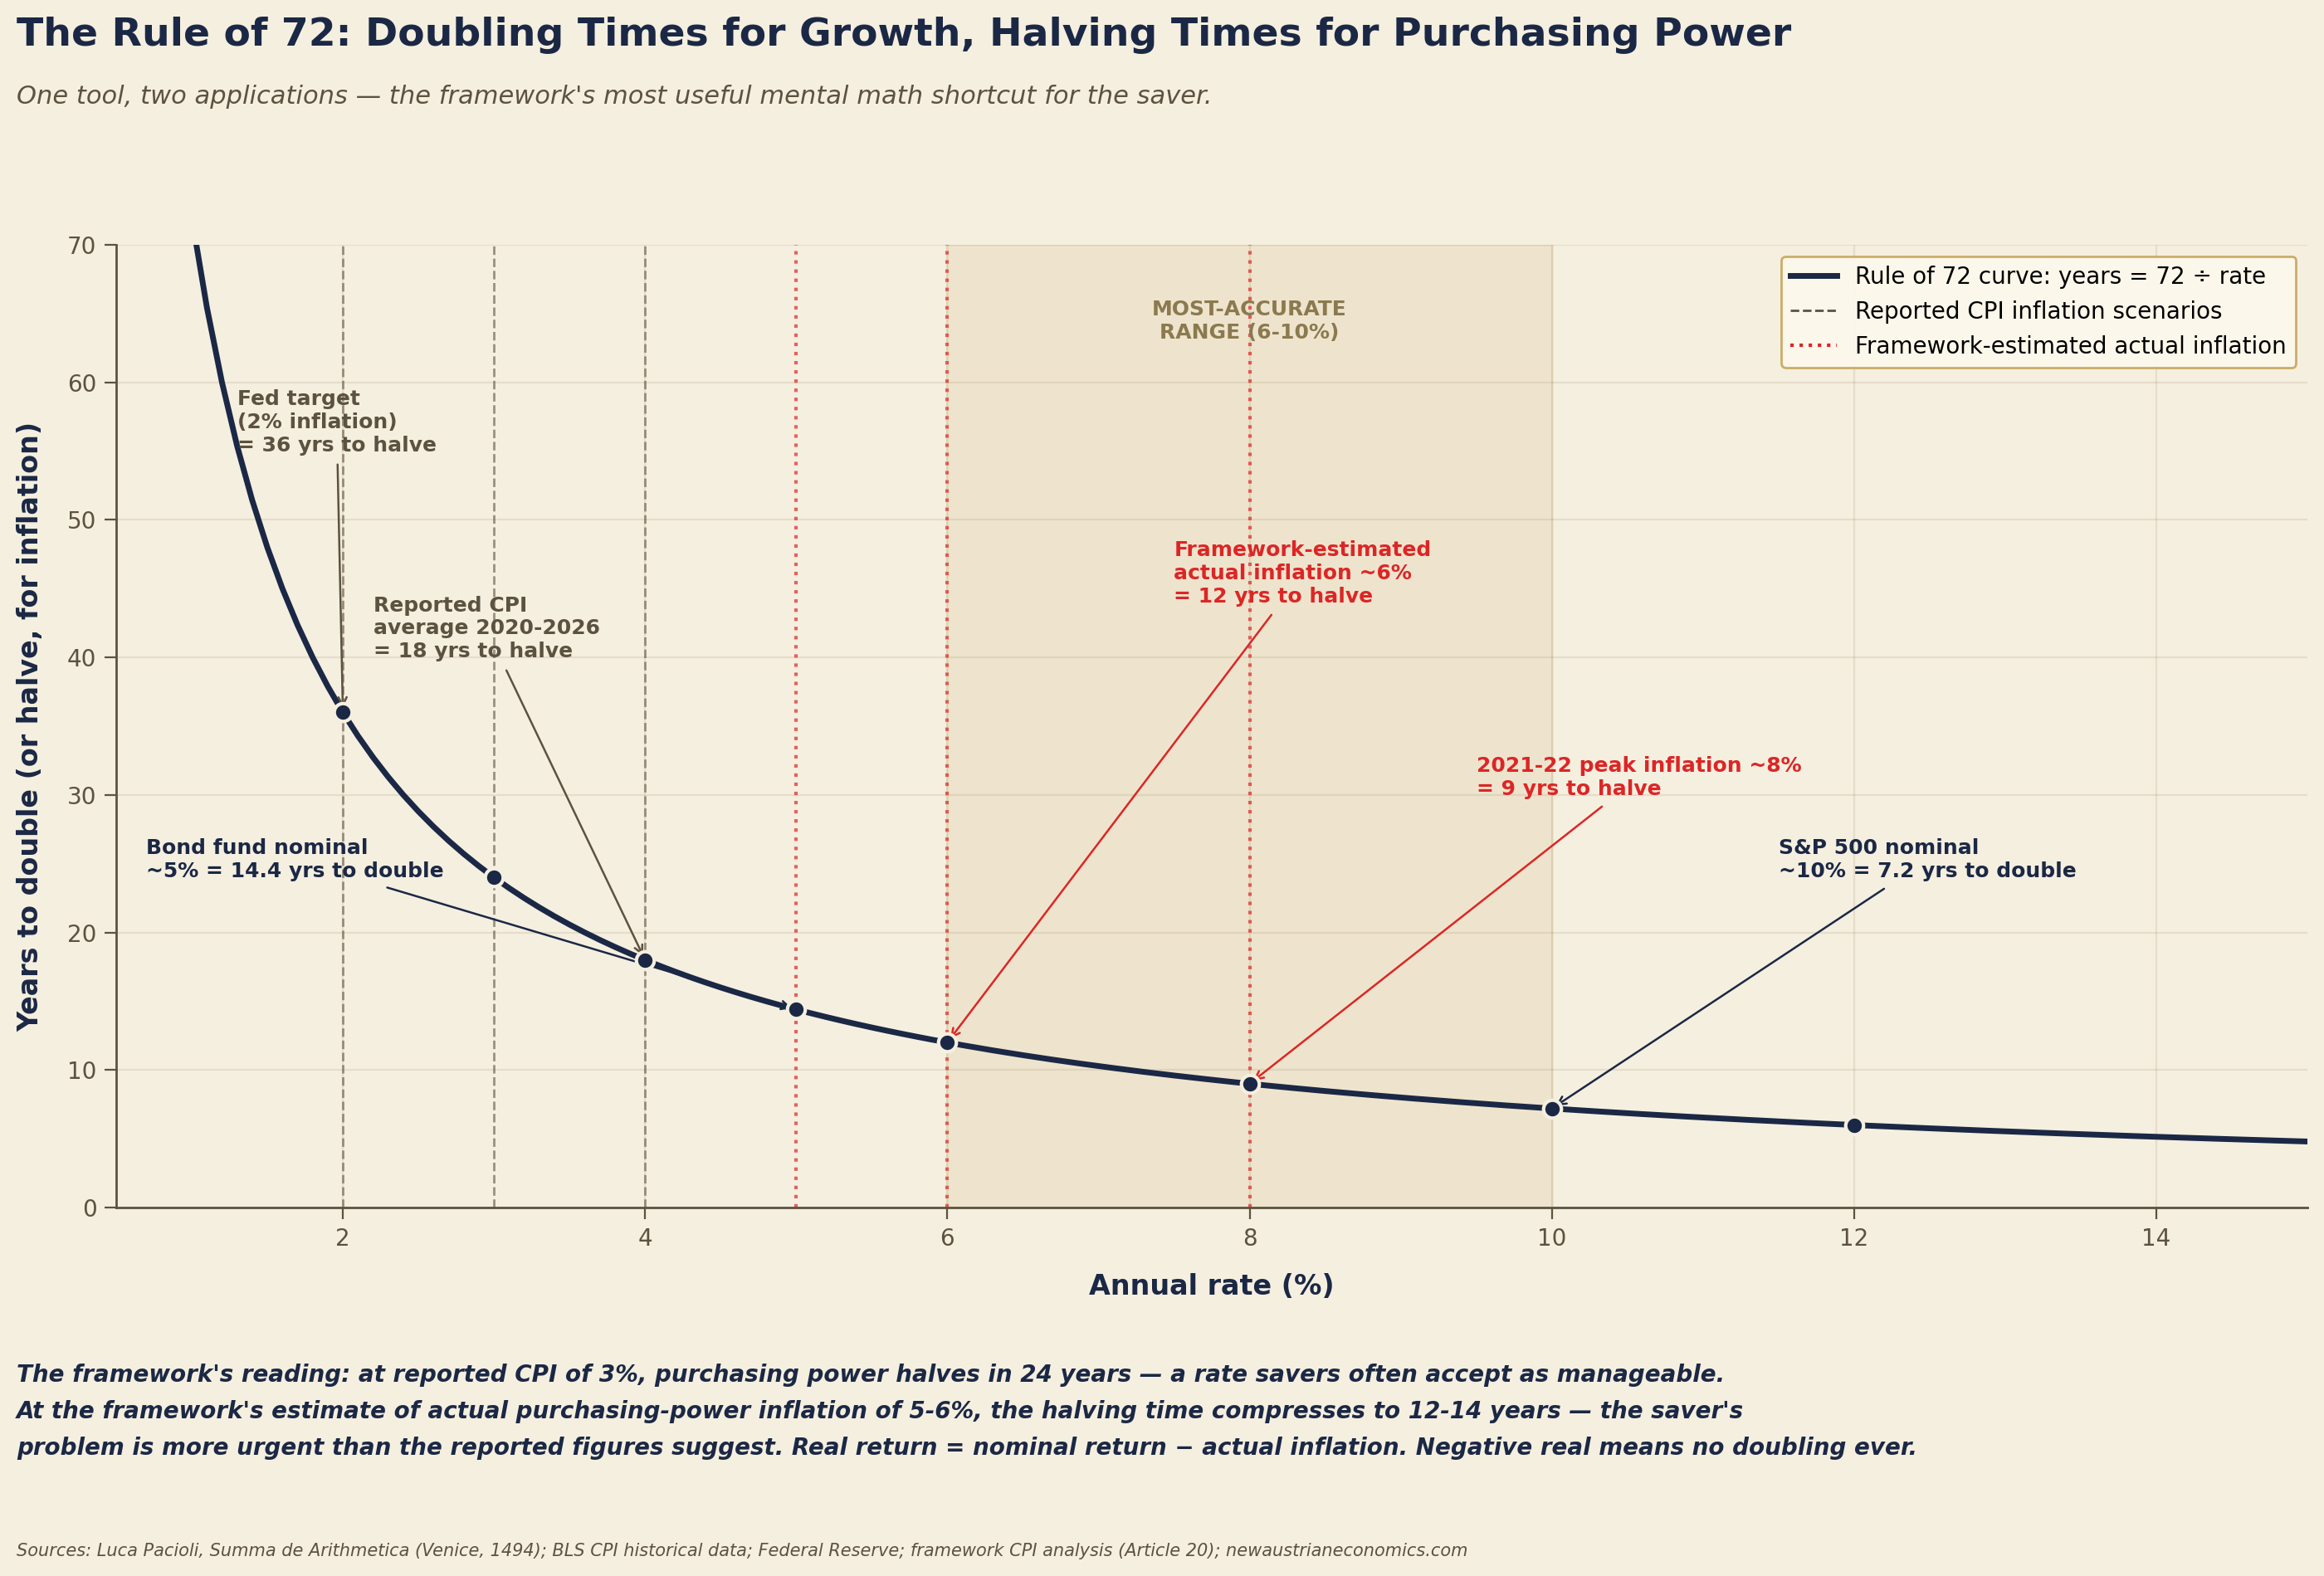
The Rule of 72 is the framework's most useful mental tool for evaluating any long-term savings decision. Any nominal return quoted for any instrument should be immediately reduced by the framework-estimated actual inflation rate, and the resulting real return should be run through the Rule of 72 to determine the actual purchasing-power doubling time. Instruments whose real return doubling time exceeds the saver's remaining working life are not accumulating real wealth; they are storing units of a depreciating account that will purchase less at withdrawal than at contribution regardless of the nominal balance.
Inside the fund company
The framework's analytical apparatus so far has proceeded from general principles applied to specific institutional structures. This section proceeds from specific personal experience applied to general principles. The author of this catalog worked as a software engineer at a mutual fund management firm with approximately $100 million in assets under management. The scale is modest by industry standards — the largest mutual fund families manage trillions — but the institutional dynamics observed at that scale generalize meaningfully to the industry as a whole. What follows is an anecdotal account of what the mutual fund industry looks like from inside, with the specific firm intentionally not identified and specific fund holdings described in general categories rather than by CUSIP.
The role provided direct read access to the firm's holdings database. Every position held across every fund managed by the firm was visible in the internal systems used for performance calculation, trade reconciliation, and regulatory reporting. The firm managed a suite of funds marketed to different investor profiles: conservative, moderate, aggressive, and various sector or thematic offerings. Each fund had a stated investment objective, a stated benchmark, a stated asset allocation target, and marketing materials that emphasized the distinctive character of that fund's approach.
The internal reality was that every fund in the suite held substantial portions of its assets in the same relatively small universe of instruments, with different weightings across funds. The conservative fund held higher weights in investment-grade bonds and short-duration paper; the aggressive fund held higher weights in equities and lower-grade credit; the sector funds held higher weights in the specific sector's constituent equities. But the underlying holdings across the suite showed substantial overlap. The mortgage-backed securities issued by Fannie Mae and Freddie Mac appeared in most funds in the suite, in different weights. The large-cap equities of the S&P 500 index appeared in most funds, in different weights. The investment-grade corporate bonds of major U.S. issuers appeared in most funds, in different weights. Beneath the differentiated marketing of the various funds sat a relatively common inventory of positions weighted differently to produce different risk-return profiles.
The most striking conversation from that period was with one of the firm's portfolio managers, whose fund had substantial AUM and a long track record. The conversation was informal — the kind of conversation that happens in the hallway or the elevator between people who work in the same building. The portfolio manager was asked what a person like the software engineer — twenty-something, no dependents, moderate income, long time horizon — should do with their savings. The portfolio manager's answer, offered without hesitation and without any of the qualifications that appear in marketing materials, was: "Just buy the index." Not one of the firm's actively managed funds. Not a portfolio constructed from careful selection of active managers. Just an S&P 500 index fund. The reasoning, elaborated over the course of the conversation, was that active management could not reliably add value over the index after fees, that most active managers underperformed their benchmarks over multi-decade periods, and that the fee structure of actively managed funds effectively guaranteed underperformance for most investors in most years.
This is not an unusual view among portfolio managers. It is well-documented in academic literature (Jensen 1968; Fama and French 2010; various S&P Dow Jones Indices SPIVA reports showing that 80-90 percent of active managers underperform their benchmarks over ten-year periods). What was distinctive about the encounter was the directness of the statement in an informal setting, from someone whose professional livelihood depended on the value of active management, offered to an employee of the firm without any of the promotional framing that appears in materials directed at fund investors.
The 2008 case and correlated risk. The framework's second observation from this period concerns what happened in 2008. Every fund in the firm's suite held some portion of its portfolio in mortgage-backed securities, primarily agency paper issued by Fannie Mae and Freddie Mac. These holdings were categorized in the marketing materials as "high-quality fixed income" or "government-sponsored enterprise securities" and were treated as roughly equivalent to Treasury securities from a credit-risk perspective. The conservative funds held the highest weights. The moderate funds held meaningful weights. Even the aggressive equity-oriented funds held some agency paper as a stabilizing allocation.
When Fannie Mae and Freddie Mac were placed into federal conservatorship on September 7, 2008, their common stock fell from approximately $7 per share to under $1 within days. 10 Their debt securities, guaranteed implicitly by the U.S. government, held their principal value — the federal takeover explicitly guaranteed the debt. But the correlated risk that the framework focuses on was visible in the broader consequences: the assumptions that had classified GSE agency paper as risk-free were revealed to be politically-contingent assumptions, the assumptions that had classified diversified investment-grade corporate bonds as low-correlation to equity holdings were revealed to be assumptions that failed under stress conditions, and the assumptions that had classified equity indices as diversified across sectors were revealed to be assumptions that broke down when systemic financial-sector distress propagated across the economy. The average diversified U.S. equity fund fell on the order of 50 percent from the October 2007 peak to the March 2009 trough, and about 37-38 percent within calendar 2008 alone — two different measurements the framework had previously run together as a single range. 11 Most funds took roughly five years to regain their 2007 peaks; the S&P 500 itself did so in March 2013. Individual investors who did not sell during the decline experienced the paper loss without realizing it; individual investors who did sell realized permanent capital losses that they never recovered.
The framework's synthesis of the mutual fund experience. What the fund company's internal view revealed was that the diversification marketed to individual investors was diversification within the substitute-layer instruments, not diversification against substrate-condition failure. When the substrate condition failed in 2008 — when the trust and institutional framework underlying the U.S. mortgage market broke down — the funds' apparent diversification did not protect investors from correlated losses across their holdings. Every fund in the firm's suite took losses because every fund held instruments whose values depended on the same substrate condition that had failed. The individual investor purchasing what appeared to be a diversified portfolio was in fact holding a differently-weighted portfolio of the same underlying substrate exposure.
The framework's reading extends this observation to the present. The 2026 mutual fund industry holds a somewhat different but structurally similar inventory of positions. Modern S&P 500 index funds are approximately 30-35 percent concentrated in seven mega-cap technology companies (the "Magnificent Seven"). 11 Bond funds hold Treasuries, corporate credit, and mortgage-backed securities in different weightings. Sector funds hold the specific sector's constituents. The apparent diversification across mutual fund products remains substantial diversification within the substitute-layer environment, not diversification against a substrate-condition failure event that would affect the entire substitute-layer environment simultaneously. The 2008 failure mode remains available. It has not been architecturally addressed. It has been institutionally accommodated through the various backstops that this catalog has documented across Articles 4, 8-10, 16, and 35-36.
A more detailed treatment of the mutual fund industry from an insider perspective would benefit from a dedicated installment in the Inside the Substitute Layer series. This section is anecdotal by design; a subsequent piece may develop the analysis more comprehensively. For present purposes, the framework's application is straightforward: the diversification that mutual funds market is real within the substitute-layer environment but is not protection against substrate-layer failure, and the individual saver considering an allocation to mutual funds should evaluate the exposure with that distinction in mind.
Cash as depreciating asset
The framework's baseline analytical claim about cash is straightforward and follows directly from the Rule of 72 discussion in Section 4. Cash held in demand-payable bank deposits, money market funds, or savings accounts earns a nominal yield that has historically ranged from approximately zero (bank checking accounts) to approximately 4-5 percent (high-yield savings accounts and money market funds during elevated interest rate environments). The Federal Reserve's stated inflation target is 2 percent. Actual inflation across the 2020-2026 window has run substantially higher — reported CPI has averaged approximately 4 percent, with the framework's Article 20 argument suggesting actual purchasing-power inflation has been higher still.
The mathematical result: cash held as a store of value across any time horizon of more than a few months experiences purchasing-power decline. During 2022, when reported CPI averaged 8 percent and peaked above 9 percent while bank deposit yields remained near zero, purchasing power was halving in roughly nine years — a rate of erosion that transformed the historically-safe cash position into a vehicle for guaranteed loss. During the 2024-2026 window with reported CPI moderating to 3-4 percent and deposit yields rising to 4-5 percent for premium products, the erosion has moderated but has not reversed. Cash held today at a 4.5 percent nominal yield against actual inflation of perhaps 4-5 percent is experiencing real return near zero or slightly negative.
The framework's precise reading. Cash is not "money" in the framework's precise sense (Article 30, Article 33). Cash is currency — a medium of exchange in the form of notes redeemable or irredeemable, per the SF School definition. Money is that kind of wealth which has a constant or nearly constant marginal utility — gold, historically silver, hard assets whose marginal utility does not decline substantially as holdings increase. Currency held as an intended store of value is a category error; currency is designed as a medium of exchange, not as a preservation instrument. The confusion between the two categories is one of the framework's persistent analytical concerns because it leads savers into positions that guarantee real losses over the multi-decade horizons that retirement savings typically require.
The framework's practical implication. Cash holdings should be sized to short-term liquidity requirements — expected expenses over the next 3-12 months, emergency reserves, transactional balances — and not to store-of-value purposes. The traditional financial-planning advice of holding "6 months of expenses in a savings account" is defensible as a liquidity provision but should not be confused with wealth preservation. Any cash held beyond genuine liquidity requirements represents ongoing exposure to monetary depreciation without offsetting real return. The framework's reading of cash is that it is a functional medium of exchange but a poor preservation vehicle, and the two functions should be kept analytically distinct in the saver's mental accounting.
Housing as anti-money
The framework's analysis of housing was developed across the Series Two housing installments (Articles 7-10) and revisited in the Series Four Watching the Cracks installments that engaged real estate and mortgage market dynamics. The core reading: housing does not function as money in the framework's precise sense. Housing is illiquid, geographically concentrated, expensive to transact, subject to substantial carrying costs, and structurally susceptible to political and regulatory changes that can alter its value without any change in the underlying property itself. The popular framing of the primary residence as "the largest investment most families will ever make" collapses the distinction between consumption and investment in a way that the framework treats as analytically important.
The specific features that distinguish housing from money. First, illiquidity. Real estate transactions typically require 30-90 days to complete under normal market conditions, and substantially longer during periods of market distress. The 2008 housing market experienced widespread inability to transact at any price for many properties for extended periods. The saver who requires liquidity from real estate holdings cannot generally obtain it on demand — the asset cannot be exchanged for money on the timescale that money itself allows. This alone disqualifies housing from the framework's monetary function.
Second, geographic concentration. A primary residence is by definition located in a single geographic location, and its value is subject to the specific local dynamics of that location's real estate market, employment market, school system, tax regime, and regulatory environment. Two identical houses in different metros can trade at prices differing by factors of five or more, and the same house's value can change dramatically over a ten-year window based on local factors independent of any general monetary or economic trend. Money, by contrast, is fungible across locations; a dollar in Ohio has the same purchasing power as a dollar in California at any given moment. Housing's geographic concentration creates a risk exposure that money does not have.
Third, transaction costs. A typical real estate transaction in the United States incurs total transaction costs of 8-10 percent of the property value when combined seller and buyer costs are aggregated: real estate agent commissions, title insurance, transfer taxes, inspection costs, mortgage origination fees, prepaid escrow amounts, and various other line items. The commission component warrants a note of caution about vintage: the 5-6 percent combined figure that this essay's 8-10 percent total assumes was the pre-2024 convention, and the National Association of Realtors settlement that took effect in August 2024 unbundled buyer-agent compensation from the listing side. Commissions are now negotiated separately and the aggregate has compressed somewhat, unevenly by market, so the total transaction cost is best read as a high single-digit percentage rather than a fixed 8-10. A property purchased for $500,000 and later sold at the same nominal price nets the seller approximately $460,000 after transaction costs. 12 The saver who purchases housing must earn approximately 8-10 percent nominal appreciation just to break even on transaction costs before considering any other factor.
Fourth, ongoing carrying costs. A homeowner pays property taxes (typically 0.5-2.5 percent of assessed value annually depending on jurisdiction), homeowner's insurance, HOA fees where applicable, maintenance and repair costs (rule-of-thumb estimates suggest 1-2 percent of property value annually), and utilities and services that would in some form apply to any housing situation. 12 Property tax is particularly worth engaging in the framework's terms — the property tax is a continuous rent paid to the local government on the ownership of the property. If the property tax rate is 2 percent and the property is held for fifty years, cumulative property tax payments equal 100 percent of the property's initial value in nominal terms. The homeowner "owns" the property but pays continuously for the privilege of that ownership.
Fifth, political and regulatory contingency. The value of a specific piece of real estate can change dramatically based on political and regulatory decisions that the property owner does not control. Zoning changes can dramatically alter a property's value. Property tax changes can reduce net cash flows. Environmental regulations can restrict permitted uses. Rent control regulations can cap the property's income-generating capacity. School district changes can affect residential values. Political control of the local jurisdiction can change tax rates, permitted uses, and enforcement patterns. Money, by contrast, is not subject to this kind of location-specific political contingency in the same way.
The framework's reading of home ownership. The framework does not argue that home ownership is universally bad. Housing provides shelter services that must be acquired one way or another — through ownership or through rental. For families with stable employment in a specific location, stable local economic conditions, and long expected holding periods, ownership may provide net advantages over rental over the specific holding period. What the framework argues is that home ownership should be evaluated as consumption of housing services combined with a leveraged bet on the specific local real estate market, not as "investment" or as a substitute for monetary savings. The two functions should be separated in the saver's mental accounting.
Anti-money. The framework's Article 8 explicitly characterized housing as "anti-money" — an asset that shares certain features with money (durability, storage of value in some sense) but that fails on the critical dimensions of liquidity, fungibility, portability, and marginal-utility constancy that define money in the framework's precise sense. A saver who allocates a substantial portion of their savings to home equity is not saving in money; they are consuming housing services on leveraged terms with a concentrated bet on the specific local market. Both functions may be individually reasonable, but neither is a substitute for the framework's monetary function.
Mutual funds and index investing — what you are actually holding
The mutual fund and exchange-traded fund industries collectively manage on the order of $42 trillion in 13 U.S.-domiciled assets: roughly $28.5 trillion across about 7,000 mutual funds, and $13.4 trillion across 4,495 ETFs at the end of 2025. ETF assets grew by some $3.2 trillion during 2025 alone, on a record $1.49 trillion of net inflows. 13 The great majority of American 401(k) participants and IRA investors hold their retirement savings entirely or predominantly in these vehicles. 14 Understanding what the vehicles actually contain, beyond the marketed labels, is essential to the framework's analysis of personal savings.
The S&P 500 index fund as core holding. The S&P 500 index tracks the 500 largest publicly-traded U.S. companies by market capitalization, weighted by market cap. The index is typically presented as a broadly diversified equity holding suitable as the equity allocation for most retail investors. As of mid-2026, however, the index is substantially concentrated: the top seven holdings (Apple, Microsoft, Nvidia, Amazon, Alphabet, Meta, and Tesla — the "Magnificent Seven") collectively represent approximately 32-34 percent of the index's market capitalization. 11 The top 25 holdings represent approximately 45-50 percent. The bottom 400 holdings collectively represent less than 20 percent. 11 An investor purchasing an S&P 500 index fund is not purchasing 500 equally-weighted holdings; they are purchasing a fund that is one-third invested in seven specific technology-adjacent companies whose fortunes are substantially correlated with each other and with the broader technology sector.
Bond funds and their credit exposure. The bond funds available in most 401(k) plans hold combinations of U.S. Treasury securities, agency mortgage-backed securities (primarily FNMA, FHLMC, and GNMA paper), investment-grade corporate credit, and — depending on the fund's mandate — high-yield credit, emerging market debt, or municipal securities. The specific weightings depend on the fund's stated objective. A typical "core bond" fund holds 30-40 percent Treasuries, 25-35 percent mortgage-backed securities, 20-30 percent investment-grade corporate credit, and small allocations to other categories. 15 The individual investor holding a core bond fund is holding claims on future currency payments from these specific issuers, at duration and credit-risk profiles determined by the fund manager. The 2022 bond market experienced approximately 13 percent losses on core bond fund allocations 15 — the Bloomberg U.S. Aggregate returned -13.0 percent for the year — as the federal funds target rose from near zero to 4.25-4.50 percent by December, and above 5 percent during 2023 — a decline of a magnitude that most bond fund investors had not experienced in the prior four decades. 2
Sector and thematic funds. The many sector and thematic funds available in retail investment platforms allow investors to concentrate their exposure in specific industries, themes, or investment styles. Technology funds, energy funds, healthcare funds, ESG funds, dividend funds, low-volatility funds, factor funds, and various other categories are marketed as offering differentiated exposure to specific market segments or approaches. The internal reality is that many of these funds hold overlapping portfolios of the same underlying stocks, weighted differently. A dividend fund and a value fund often hold many of the same large-cap dividend-paying stocks. A technology fund and an S&P 500 index fund both hold substantial positions in the Magnificent Seven. The apparent differentiation is often less than the fund names suggest.
The correlated-risk observation. The framework's Article 16 documented what happens during periods of substrate-level stress: instruments that appear uncorrelated during normal periods reveal their correlations under stress. The 2008 crisis, the 2020 pandemic sell-off, the 2022 bond market decline, and the various other stress events of the past two decades all exhibited the same pattern — assets that had been priced as diversified fell together, and the diversification benefit that was theoretically present in normal periods disappeared exactly when it was most needed. The mutual fund investor holding what appears to be a diversified portfolio of index funds, sector funds, and bond funds is holding a diversified portfolio within the substitute-layer environment, not a portfolio diversified against substrate-condition failure.
The framework's practical implication for mutual fund allocations. The framework does not argue against mutual fund holdings entirely. It argues for clarity about what those holdings actually represent. A mutual fund allocation is an allocation to the substitute-layer environment at a specific weighting; it provides exposure to the returns available in that environment during normal periods and to the losses available in that environment during stress periods. The saver should size their mutual fund allocation to their actual willingness and ability to tolerate substrate-condition-failure losses without forced selling — because forced selling during the losses converts paper losses into permanent capital losses, and the mutual fund vehicle does not protect against that dynamic. Some percentage of savings held outside the substitute-layer environment entirely — in the hard-asset categories discussed in the next section — provides the actual diversification against substrate-condition failure that the mutual fund vehicles do not provide.
The self-directed Solo 401(k) — the escape valve
For the meaningful subset of American workers who have any 1099 income, self-employment income, single-member LLC operations, or partnership income, a specific institutional structure exists that provides substantially more flexibility than the employer-sponsored 401(k). The Solo 401(k), also known as the One-Participant 401(k), Individual 401(k), or Uni-K, is available to self-employed individuals and business owners with no common-law employees other than a spouse. The plan can be established by sole proprietorships, single-member LLCs, S corporations, partnerships, and other pass-through entities. Anyone receiving 1099-NEC or 1099-K income and paying self-employment taxes qualifies.
Contribution structure. The Solo 401(k) allows contributions in two capacities. As the employee, the individual can contribute up to $24,500 in salary deferrals for 2026 (same limit as employer-sponsored plans). As the employer, the individual can additionally contribute up to 25 percent of W-2 compensation 16 (for S corporations and other entities that pay W-2 wages) or 20 percent of net earnings from self-employment (for sole proprietors and partners). The combined limit is $72,000 for 2026, or $80,000 with the standard catch-up, or $83,250 with the super catch-up. These limits are substantially higher than what most employer-sponsored 401(k) plans effectively allow, because the employee is also the employer and can therefore capture both contribution sides.
Self-directed variants. The critical framework distinction. Standard Solo 401(k) accounts opened at Fidelity, Vanguard, Schwab, or E*TRADE offer the same investment menu that employer 401(k) plans offer — mutual funds, ETFs, individual stocks, and bonds available through the sponsoring brokerage. This is the same substitute-layer environment discussed in the previous section, applied through a Solo 401(k) wrapper. The additional flexibility of the Solo 401(k) at these mainstream providers is modest.
The self-directed Solo 401(k), by contrast, is structured through specialty plan administrators such as IRA Financial (Adam Bergman's firm, which reports more than 27,000 clients; its own published asset figure has appeared variously as over $5 billion and over $8 billion at different dates, so the framework gives the client count and leaves the asset total as a range), MySolo401k.net, Rocket Dollar, Solera, and others. The self-directed structure typically involves the establishment of an LLC by the plan administrator, with the plan participant serving as trustee and having "checkbook control" over the plan's assets. This structure enables direct investment in a substantially wider universe of assets than the mainstream brokerage Solo 401(k) accounts allow:
- Real estate (direct property ownership, rental properties, promissory notes secured by real estate, tax liens)
- Physical precious metals (gold and silver bullion, certain qualifying coins under IRS Publication 590 rules)
- Private lending (peer-to-peer loans, direct promissory notes)
- Private equity and private placements
- Cryptocurrency and digital assets (with appropriate custody arrangements)
- Direct business investments (subject to prohibited transaction rules)
- Franchises and small businesses (with careful attention to disqualified-person restrictions)
- Foreign real estate (with additional compliance requirements)
The framework's reading of the self-directed Solo 401(k). For the eligible saver, this structure represents the most flexible institutional vehicle currently available for retirement savings. The tax advantages are identical to those of the employer-sponsored 401(k) — pre-tax contributions reducing current taxable income, tax-deferred growth, and taxation at ordinary income rates on distributions after 59½. The investment flexibility is dramatically expanded, permitting allocation to hard assets and alternative structures that are impossible in the employer-sponsored environment. The administrative burden is somewhat higher — the self-directed structure requires attention to prohibited transaction rules, disqualified-person restrictions, and specific compliance requirements that mainstream 401(k) plans handle for the participant — but the additional burden is manageable for most individuals willing to invest modest time in learning the rules.
Practical considerations. The establishment deadline has moved. Before SECURE 2.0 the plan had to exist by December 31 of the tax year; a sole proprietor may now adopt a plan after year-end and still make first-year elective deferrals, provided it is adopted by the tax filing deadline without extensions — April 15 for a calendar-year filer. Employer profit-sharing contributions can still be made up to the filing deadline including extensions. Practitioners nonetheless generally advise establishing by December 31 where possible, because the later route compresses the deferral deadline to April 15 even when the business return is extended. The specialty administrators charge annual fees typically ranging from $300 to $1,500 depending on the complexity of the account. The prohibited transaction rules — which prevent, for example, self-dealing between the plan participant and the plan's investments, and which prohibit investments involving disqualified persons such as immediate family — require careful attention but are not conceptually complex. The IRS resources at irs.gov and Publication 560 provide detailed guidance.
The framework's practical implication. For savers eligible to establish a Solo 401(k) — which includes anyone with any consistent self-employment income, side business, freelance work, or 1099-earning activity — the self-directed variant provides a specific structural mechanism to hold retirement assets in categories that are not accessible through employer-sponsored plans. This is the framework's most concrete institutional recommendation in this essay: for eligible savers, evaluating whether the self-directed Solo 401(k) structure fits the individual's circumstances is worth doing carefully, because the alternatives available in employer-sponsored plans are structurally limited to the substitute-layer instruments discussed in the preceding sections.
Hard asset diversification
The framework's core reading of hard assets follows directly from the Menger and Fekete work engaged in Articles 1-6 and 33. Gold and silver are money in the framework's precise sense — wealth with constant or nearly constant marginal utility, held for centuries as monetary substrate across every major civilization, characterized by the physical properties (durability, divisibility, portability, fungibility, scarcity, verifiability) that Menger identified in 1892 as the emergent characteristics of the commodity that spontaneously becomes the medium of exchange under conditions of voluntary trade. In the pre-1971 monetary architecture, gold was the substrate on which the dollar was defined; in the post-1971 environment, gold exists in parallel to the dollar as an alternative unit of monetary account that the international financial system has neither formally repudiated nor formally reintegrated.
The framework's specific claim. A meaningful percentage of individual savings held in physical monetary metals — gold and silver in bullion, coins, or bar form, held either in direct personal possession or in appropriate custody arrangements outside the fractional-reserve banking system — provides the diversification against substrate-condition failure that mutual fund holdings do not provide. The percentage varies by individual circumstance, but the framework's reading suggests that most savers should hold at least 5 percent and up to perhaps 25 percent of their total savings in this category, with the specific level calibrated to the saver's overall exposure to substitute-layer instruments, their income stability, their proximity to retirement, and their willingness to accept the specific tradeoffs that physical precious metals impose.
The tradeoffs. Physical gold and silver do not generate cash flow. They do not pay dividends, interest, or rent. They must be stored in ways that provide security against theft or loss. They incur transaction costs when purchased (typically 3-8 percent above spot for retail-quantity gold, higher for silver) and when sold (typically 1-3 percent below spot for direct sales to dealers, higher for private sales). They are subject to specific tax treatment as collectibles under IRC Section 408(m), taxed at a maximum federal rate of 28 percent on long-term capital gains rather than the 20 percent rate applicable to most other long-term capital gains. 17 They are subject to counterparty risk when held in custody arrangements (COMEX warrants, ETF share representations, allocated storage accounts) — a risk that the framework's Articles 33 and 34 have documented as substantial and growing.
The framework's reading of the tradeoffs. These tradeoffs are real and should be acknowledged. What the framework claims is that these tradeoffs are the price paid for holding actual money as defined by the framework rather than substitute-layer instruments. The absence of cash flow reflects the fact that gold is money and money does not typically pay income — dollars in a mattress do not pay income either. The storage requirements reflect the physical reality of a physical asset — which is also the reason gold cannot be conjured into existence by a central bank in the way that currency can. The transaction costs reflect the specialized markets for physical metal, which are smaller and less efficient than the electronic markets for equities and bonds — but which also cannot be shut down by a single institution or policy decision. The tax treatment is unfavorable relative to other capital gains — a specific choice by Congress that has persisted through multiple administrations and that the individual saver simply has to accommodate.
Physical vs paper gold. The framework's Articles 33 and 34 documented the distinction between paper claims on gold (COMEX warrants, GLD ETF shares, allocated storage accounts at fractional-reserve institutions) and physical gold in direct possession or in fully-allocated custody outside the fractional-reserve banking system. During normal periods, the distinction is largely economic in nature — paper gold trades near physical gold, arbitrage keeps the prices aligned, and the choice between them is a question of convenience versus counterparty risk. During stress periods, the distinction becomes critical: paper gold's value depends on the ability to convert paper claims into physical delivery, and that ability has repeatedly proven to be constrained during precisely the moments when investors most want to make the conversion. The permanent backwardation thesis (Atlas: Permanent Backwardation) is the framework's expression of the limit case in which paper gold's connection to physical gold breaks down entirely.
An important correction, added August 2026. The framework's treatment of allocated storage in this section was incomplete in a way that Article 47 of this catalog corrects in full. Allocated custody protects comprehensively against custodian insolvency — the bailment structure places metal outside the custodian's bankruptcy estate, as Lehman Brothers demonstrated in 2008 — but provides no protection whatsoever against custodian fraud, because the entire structure presupposes the metal is in the vault. In the largest such case in United States history, roughly 2,100 customers of First State Depository in Wilmington, Delaware held metal in individually labeled boxes under exactly the arrangement this section recommends; many were retirees holding through IRA and 401(k) accounts. 18 When the court-appointed receiver arrived, the boxes contained IOU slips. The Custody Depth score introduced in this article's July 2026 revision measured intermediation and did not measure verification, and Article 47 replaces it with a two-stage framework in which independent verification is a precondition rather than a secondary consideration. Readers acting on this section should read Article 47 before selecting a depository.
The framework's practical implication. For savers seeking exposure to hard assets, physical possession or allocated storage outside the fractional-reserve system provides the security that the framework's monetary analysis contemplates. Paper gold products provide convenient exposure, but not the tax advantage commonly attributed to them. GLD and IAU are grantor trusts holding physical metal, and the IRS treats a shareholder as owning a proportional share of that metal directly — so long-term gains are taxed at the same maximum 28 percent collectibles rate as the bullion itself, not at 20 percent. The favorable-rate claim holds only for instruments that do not hold metal directly: mining-equity funds and futures-based funds are taxed as ordinary securities, and Sprott's PHYS is a passive foreign investment company for which a shareholder can make a qualified electing fund election to obtain capital-gains treatment. The practical implication is the reverse of the usual assumption: a saver choosing GLD over coins is accepting counterparty and custody layers without buying any tax advantage at all. Silver, platinum, and palladium provide additional hard-asset diversification with different physical characteristics and industrial-use exposures than gold. The specific mix among these options depends on the saver's individual analysis of their tradeoffs.
The jurisdictional axis
The framework's structural split in this essay — outside the substitute layer versus inside it — is organized along a single axis: asset class. This section names a second, largely independent axis that the framework's treatment to this point has underweighted: the political and legal jurisdiction in which the asset, and the saver, are situated.
Consider a specific comparison. A saver holds a gold coin in a home safe in Ohio and an S&P 500 index fund in a brokerage account also domiciled in Ohio. On the framework's asset-class axis, these two holdings are maximally different — one is money in the framework's precise sense, held at Custody Depth zero; the other is a substitute-layer instrument held at Custody Depth three. On the jurisdictional axis, however, these two holdings share an identical exposure: both are subject to the same sovereign's tax authority, the same sovereign's capital controls should they ever be imposed, the same sovereign's confiscation power should history repeat the 1933 episode in some updated form, and the same sovereign's legal and political stability more generally. A framework that maps the asset-class axis carefully while leaving the jurisdictional axis unexamined has described only part of the correlation structure that matters in an actual substrate-condition failure.
What jurisdictional diversification concretely means. At the individual level, several mechanisms exist, each with substantially different costs and substantially different degrees of practical accessibility: ownership of real property in a second jurisdiction; bullion or currency holdings in allocated storage outside the saver's home country (Switzerland, Singapore, and a small number of other jurisdictions maintain long-standing specialty vaulting industries for exactly this purpose); a foreign bank account, subject in the U.S. case to FBAR and FATCA reporting requirements that reduce but do not eliminate the diversification value; and, at the most involved end, a second residency or citizenship that provides a legal fallback independent of the saver's home jurisdiction's continued stability. None of these mechanisms is costless, several carry meaningful complexity and compliance burden, and the framework does not suggest that jurisdictional diversification is accessible to or appropriate for every saver at every stage of accumulation. The point is narrower: the jurisdictional axis is a real and largely separate dimension of the correlated-risk problem this catalog has documented since Article 16, and a saver's risk assessment that considers only asset class without considering jurisdiction is incomplete in a specific, correctable way.
Why this belongs in the framework rather than outside it. The Mengerian and Feketean apparatus this catalog has developed is a theory of monetary substance — what functions as money, and why. It is largely silent on the separate empirical question of what jurisdiction offers the most durable protection of property rights, rule of law, and continuity of institutions, which is a question of political history rather than monetary theory. The framework's position is that both questions matter to a saver assessing substrate-condition risk, that this catalog has developed a rigorous apparatus for the first question and essentially none for the second, and that a fuller treatment of jurisdictional risk as its own analytical category is a natural and necessary extension of the framework's savings apparatus — one this catalog takes up directly in a forthcoming series addressing exactly this gap, discussed in the closing section below.
Technical trading vs fundamental analysis
The framework's engagement with technical trading requires some careful distinctions. The dominant paradigm in financial media and academic finance is fundamental analysis — the evaluation of individual securities based on the underlying business's earnings, cash flow, asset value, growth prospects, and other economic characteristics. Fundamental analysis has a substantial intellectual history (Graham and Dodd, Buffett and Munger, various academic traditions) and remains the primary framework in which most professional investment analysis is conducted. Technical analysis — the evaluation of price patterns, momentum indicators, chart formations, and other price-derived signals without direct reference to underlying business fundamentals — is often characterized in academic finance as unreliable or as reflecting cognitive biases rather than actionable information.
The framework's reading is more nuanced than either paradigm's self-presentation. Fundamental analysis is essential for understanding what a specific security represents and what its long-term value drivers are. Technical analysis is essential for understanding what price is doing in the near-term and where entry and exit points might be located. Both are tools, and both have specific ranges of applicability that the practitioner must recognize.
The specific case for technical analysis under substrate-fragility conditions. Fundamental analysis operates most effectively when the substrate condition is stable — when the currency in which prices are quoted has stable purchasing power, when tax and regulatory regimes are predictable, when interest rates reflect underlying economic conditions, and when financial reporting standards produce numbers that meaningfully reflect underlying economic reality. Under substrate-fragility conditions, several of these premises weaken. The currency depreciates in ways that affect nominal earnings comparisons across time. The regulatory environment shifts in ways that alter industry profitability profiles. Interest rates are manipulated by central bank policy in ways that distort discount rate assumptions used in fundamental valuation. Financial reporting incorporates accommodations (extend-and-pretend on distressed credit, mark-to-model on illiquid assets, various forbearance mechanisms) that reduce the information content of reported numbers. Under these conditions, fundamental analysis produces conclusions that may not be tradable — the analysis may be correct about long-term value but incorrect about the timing over which that value gets recognized in market prices.
Technical analysis operates on a different premise. It examines the specific pattern of price action, the momentum characteristics of that price action, and the relationship of current prices to historical support and resistance levels. It does not claim to identify fundamental value; it claims to identify near-term price behavior that is likely to persist based on the persistence of the participants generating that behavior. Under substrate-fragility conditions where fundamental value is difficult to estimate reliably, the price patterns themselves become more informative relative to fundamental estimates that may not translate into market pricing on any tradable timeline.
Fibonacci retracements as illustration. The Fibonacci retracement tool, in wide use across technical trading platforms, plots specific percentage levels between a significant price high and a significant price low: 23.6 percent, 38.2 percent, 50 percent, 61.8 percent (the "golden retracement"), and 78.6 percent. The percentages derive from ratios within the Fibonacci sequence — 0.618 is the reciprocal of the golden ratio φ ≈ 1.618, which is the limit of the ratio between consecutive Fibonacci numbers. Traders use these levels as potential support and resistance zones where price action might pause, reverse, or continue after a retracement.
The framework's reading of why Fibonacci retracements work in practice: not because there is anything mystical about the golden ratio or about the Fibonacci sequence in financial markets specifically, but because enough market participants use these levels that they become self-referentially predictive. When enough traders draw the same Fibonacci lines on the same charts and place orders near those levels, the price does respond to those levels — not because of any underlying economic logic, but because of the coordination equilibrium the shared tool creates. This is the market functioning as social technology: a shared analytical framework used by many participants creates the price patterns that the framework predicts, in a self-reinforcing feedback loop.
The framework's reading does not diminish Fibonacci retracements as useful tools. Coordination equilibria are real. The fact that price patterns exist because participants believe they exist does not make the patterns less tradable — it may make them more tradable, because the patterns will persist as long as enough participants continue to use them. What the framework does is provide the theoretical foundation for understanding why technical tools work when they work, which is different from the various pseudo-mystical explanations sometimes offered.
Chris Vermeulen and Asset Revesting. The Canadian analyst Chris Vermeulen, founder of The Technical Traders and author of Technical Trading Mastery (Second Edition, 2024) and Asset Revesting, has articulated a specific technical-trading approach that maps onto the framework's analysis in interesting ways. Vermeulen's "Asset Revesting" concept — a term he coined to distinguish his approach from traditional buy-and-hold investing — emphasizes exclusively holding assets that are rising in value at any given time, rotating capital out of assets that are falling, and using technical signals to time the transitions. His BAN system ("Best Asset Now") applies technical analysis, momentum indicators, cycle analysis, and market sentiment to identify which asset class is currently trending and to concentrate capital in that class until the technical picture indicates a change.
Vermeulen's stated statistical claim, cited on his firm's marketing materials: "97 percent of investors who actively trade for 300 days or more, even during bull markets, lose money." Article 42 has since traced the figure to its apparent origin — Chague, De-Losso and Giovannetti's 2020 study Day Trading for a Living?, which found that 97 percent of individuals who day-traded Brazilian equity index futures for more than 300 days lost money. 19 The number is real; the population is day traders in one contract in one market rather than investors generally, and it should be read at that scope. The underlying phenomenon it captures — that most active traders underperform passive strategies, that emotional decision-making produces poor outcomes, and that discipline is more valuable than analytical sophistication in most trading contexts — is well-established across academic literature (SPIVA reports, various behavioral finance studies). Vermeulen's approach addresses these findings by proposing a specific mechanical discipline: exit assets when technical signals indicate weakness, rotate into currently trending assets, and accept that this approach will produce more transactions than buy-and-hold while claiming to reduce maximum drawdowns dramatically.
The framework's engagement with Asset Revesting. The framework's analysis supports Vermeulen's core insight — that holding falling assets during multi-year drawdowns destroys wealth in ways that the buy-and-hold narrative obscures. The 2008 drawdown, during which the S&P 500 fell 55 percent peak-to-trough, and the 2000-2002 drawdown, during which the NASDAQ fell 78 percent, both produced permanent capital losses for investors who could not or did not hold through the recovery periods. Investors who sold at the bottom locked in losses; investors who could not hold because they needed liquidity for retirement expenses realized the losses at whatever price the market offered. The framework's Article 27 documented how the extend-and-pretend regime at institutional scale produces similar dynamics at the corporate level; the individual investor experiences the analogous dynamic at the personal-portfolio level.
Where the framework diverges from Vermeulen's specific product suite is in the scope of what the framework treats as monetary versus substitute-layer. Vermeulen's approach rotates capital across substitute-layer instruments (stock ETFs, bond ETFs, cash) based on technical signals. The framework's analysis suggests that some portion of savings should be held outside the substitute-layer environment entirely — in physical monetary metals or other hard assets — and that the rotation across substitute-layer instruments is a separate question from the substrate-level allocation. Vermeulen's technical approach applied to the substitute-layer allocation is consistent with the framework's reading; it is not, however, a complete solution to the framework's identified problem of holding wealth entirely within a depreciating unit of account.
The framework's practical implication. For savers who wish to actively manage the substitute-layer portion of their savings, technical analysis provides a specific analytical toolkit that has been articulated and refined by practitioners including Chris Vermeulen. His books provide a useful entry point into these tools; his firm provides ongoing signals for those who prefer to follow specific recommendations rather than developing independent analytical capabilities. The framework's reading endorses the general approach — mechanical discipline, exit rules on all positions, avoidance of prolonged drawdowns — without endorsing any specific product offering. For readers interested in developing self-management capabilities, Vermeulen's Technical Trading Mastery is a reasonable starting point among several available options.
The framework's synthesis — principles for navigation
The preceding sections have engaged specific institutional structures, mathematical tools, personal-experience observations, and analytical readings of specific practitioner approaches. This section synthesizes the framework's principles for personal savings navigation under the current substrate conditions. What follows is not a prescription for any specific reader. It is a set of principles that any reader can translate into their own specific circumstances, ideally in consultation with qualified professionals.
Principle one: the employer match probably deserves capture up to vested minimum, but not necessarily beyond. Nominal dollars are real dollars, and even inflation-eroded nominal dollars typically retain some purchasing power. But the additional pre-tax contributions beyond the match warrant individual analysis rather than default maximization. The lock-up period, the uncertain future tax rules, and the constrained investment menu of the employer-sponsored 401(k) all mean that additional contributions beyond the match are not automatically better than alternatives.
Principle two: the Rule of 72 applies to all long-term savings decisions, and inflation is the enemy of the saver. Any nominal return should be evaluated against a framework-estimated actual inflation rate (which the framework's Article 20 argues is meaningfully higher than reported CPI). The real return determines whether purchasing power is being preserved or eroded. Instruments with real returns near zero or negative over the saver's holding period are consuming capital, not preserving it, regardless of nominal balance appearances.
Principle three: cash is not money, and cash held beyond genuine liquidity requirements is exposure to guaranteed real loss. Cash's function is transactional and short-term-liquidity provision. Cash held as an intended store of value across multi-year or multi-decade horizons is a category error that the framework's analysis treats as one of the most common savings mistakes.
Principle four: housing is consumption of housing services combined with a leveraged bet on a specific local real estate market, not investment or monetary savings. Home ownership may be individually reasonable for many households in many circumstances, but it should be evaluated as consumption + leveraged local-market bet, not as a substitute for the framework's monetary function. The transaction costs, carrying costs, illiquidity, and political contingency all argue against treating housing as a preservation vehicle.
Principle five: mutual funds and ETFs provide diversification within the substitute-layer environment, not diversification against substrate-condition failure. These instruments have their uses — they provide low-cost access to diversified equity or fixed-income exposure — but they should be sized to the saver's genuine willingness and ability to tolerate substrate-condition-failure losses without forced selling. Some percentage of savings held entirely outside the substitute-layer environment provides the actual diversification against systemic failure that these vehicles do not provide.
Principle six: the self-directed Solo 401(k) is available to eligible savers and warrants evaluation. For anyone with any self-employment or 1099 income, the self-directed structure provides substantially more institutional flexibility than employer-sponsored plans while retaining the same tax advantages. The additional administrative burden is modest for individuals willing to engage the rules. Adam Bergman's IRA Financial, MySolo401k.net, and other specialty administrators provide platforms for establishing such accounts.
Principle seven: hard assets in the framework's precise monetary sense (gold, silver, and to some extent other physical metals) provide the diversification against substrate-condition failure that substitute-layer instruments do not. A meaningful percentage — 5 to 25 percent depending on individual circumstances — held in this category represents an allocation to actual money as the framework defines money, rather than to substitute-layer claims on future currency payments. Physical possession or fully-allocated custody outside the fractional-reserve banking system provides the security that the framework's analysis contemplates.
Principle eight: technical analysis provides a specific toolkit for managing the substitute-layer portion of savings. Fundamental analysis under substrate-fragility conditions produces conclusions that may not translate into tradable price movements on any actionable timeline. Technical patterns, including but not limited to Fibonacci retracements, provide near-term price behavior information that is often more actionable than fundamental estimates. Chris Vermeulen's Asset Revesting concept — exclusively hold assets rising in value, rotate on technical signals — provides one specific articulation of the general principle that avoiding multi-year drawdowns is more valuable than optimizing entry prices. Individual investors willing to develop technical capabilities can implement variants of this approach themselves; those preferring to follow specific signals can subscribe to Vermeulen's or other practitioners' services.
Principle nine: the universal failure mode is being a forced seller, not holding the wrong asset. The framework's reading of the various historical drawdowns — 2000-2002, 2008-2009, 2020, 2022 — is that permanent capital losses occurred primarily among investors who were compelled to sell at the worst possible moment, not primarily among investors who held the wrong instrument. Exit strategies on individual positions are one specific defense against this failure mode, but the more general principle is structural: leverage, illiquidity, and an unavoidable liquidity need are together the necessary and sufficient conditions for forced selling, and any one of the three can usually be avoided by design. Carry no leverage, or as little as circumstances truly require. Keep fixed obligations — mortgage payments, debt service, contractual commitments — low enough relative to income and reserves that no plausible market event forces a transaction. Maintain sufficient genuine liquidity (Principle 3) that a drawdown in less-liquid holdings never has to be realized to meet an obligation. Defined exit strategies on individual positions remain a useful specific tool, particularly for the technical-analysis-managed portion of a portfolio (Principle 8), but the broader and more important discipline is to structure the saver's overall financial life — obligations, leverage, and liquidity together — such that the saver is never a forced seller of anything, at any price, at any moment.
Principle ten: individual sovereignty over savings decisions is worth protecting. The framework's various institutional analyses across this catalog have documented the mission-drift, capture-by-stakeholders, and structural constraints of the major institutional actors in the financial system. Individual savers who delegate all decision-making to financial advisors, fund managers, or plan administrators are accepting the specific interests, biases, and constraints of those institutional actors. The framework's reading endorses individual education, individual analysis, and individual decision-making as the structural counterweight to the institutional dynamics documented elsewhere in the catalog. This is not an argument against professional advice — qualified professionals provide genuine value in tax, legal, and specific technical questions — it is an argument for the individual saver maintaining ultimate ownership of the decisions that determine their financial trajectory.
Principle eleven: human capital is very often the dominant asset, particularly early in a working life, and should be the first priority rather than an afterthought to portfolio allocation. As developed earlier in this essay, earning power — the scarcity, currency, and adaptability of the saver's own skills — cannot be confiscated, is not fixed in nominal terms the way currency-denominated claims are, cannot be rehypothecated or frozen by a custodial dispute, and travels with the saver across jurisdictions. For a saver with several decades of working life ahead, disproportionate investment in skill and professional positioning is very often the higher-expected-value, more robust decision relative to any specific reallocation within the financial portfolio, and the principles above should be read as governing the secondary question of what to do with savings, not the primary question of how to generate them.
Principle twelve: asset class is not the only axis of diversification; jurisdiction is a second, largely independent axis the framework's core apparatus does not by itself address. A gold coin and a brokerage account held in the same jurisdiction share political and sovereign risk that an asset-class-only framework understates. Jurisdictional diversification — through foreign real property, allocated storage in a stable specialty-vaulting jurisdiction, or, at the most involved end, a second residency — addresses a distinct risk dimension from the money-versus-currency distinction this catalog's Mengerian apparatus develops, and savers assessing substrate-condition risk should treat the two dimensions as separate and both worth considering.
A worked illustration. Consider a hypothetical thirty-five-year-old software engineer with $150,000 in annual income, $80,000 in an existing employer-sponsored 401(k), no other significant savings, a stable employment situation, no dependents, and a stated risk tolerance for equity market volatility but a concern about the framework's substrate-fragility observations. One allocation consistent with the framework's principles, for consideration and adaptation to the individual's specific circumstances:
- Continue contributing to the employer-sponsored 401(k) up to the vested match maximum, while recognizing the account itself carries Custody Depth 4-5 regardless of what it holds
- Redirect contributions above the match to a self-directed Solo 401(k) if any 1099 income exists (or establish 1099 income streams if practical) — with a split between mainstream ETF holdings and physical precious metals within that account
- Establish a taxable brokerage account for tactical positions managed on technical rules
- Physical gold and silver allocation targeting 10-15 percent of total savings, weighted toward Custody Depth 0-1 — direct possession and allocated storage — rather than paper claims
- Cash held at 3-6 months of expenses for genuine liquidity, no more
- Home ownership evaluated as housing consumption + local real estate bet, purchased only if long expected holding period and stable employment in the location; otherwise renting is analytically defensible
- Continued, disproportionate investment in professional credentials, technical skill currency, and career positioning — treated as the dominant asset for the first one to two decades of this saver's working life, ahead of any portfolio consideration above
- Modest jurisdictional diversification if accessible — a portion of the metals allocation held in allocated storage outside the saver's home jurisdiction — weighed against the added complexity and cost
- Continuous education in technical analysis to develop self-management capabilities over the multi-decade savings horizon
This is one illustration among many possible allocations consistent with the framework's principles. Individual circumstances will drive different specific choices. What matters is that the choices are made with clarity about what each instrument actually represents in the framework's terms, not with the marketing framings under which they are typically presented.

The closing
The framework's engagement with the personal savings question sits uncomfortably at the intersection of analytical rigor and prescriptive necessity. The catalog's ordinary posture is diagnostic — the framework reads the world, documents institutional dynamics, and offers analytical observations without generally telling readers what to do about them. The personal savings question forces a partial departure from that posture, because individual readers face specific decisions about specific dollars in specific institutional structures on specific timelines, and analytical observations without any practical translation are of limited use to them.
This essay has attempted to make the translation while preserving the framework's analytical character. The mathematical tools (Rule of 72), the institutional analysis (401(k) mechanics, Solo 401(k) structures, mutual fund industry dynamics), the personal-experience observation (the view from inside a fund company), the practitioner reference (Chris Vermeulen's Asset Revesting), and the framework's own synthesis of monetary versus substitute-layer instruments have all been engaged. The principles offered in the preceding section are, the framework hopes, useful. But they are principles, not prescriptions.
The Golden Triangle architecture described in Article 33 of this catalog is not returning on any near-term timeline. The Federal Reserve, the Treasury, the fiscal apparatus, the international dollar system, and the various institutional stakeholders documented across this catalog show no signs of restoring the pre-1971 monetary architecture. Various alternative architectures are being constructed in parallel — China's physical gold clearing system documented in Article 34, the various sovereign digital currency initiatives, the cryptographic settlement architectures documented in Article 6 — but none of these has yet achieved the scale or stability required to serve as an alternative substrate for the global savings function. For the current generation of savers and probably for several generations to come, personal savings will occur within the substitute-layer environment, with such hedges against substrate-condition failure as the individual saver can construct.
The framework's fundamental analytical claim, restated at the close of this essay: savings held entirely within the substitute-layer environment, in any combination of currency, deposits, bonds, stocks, mutual funds, ETFs, or real estate, are exposed to substrate-condition failure in ways that the marketing of those instruments does not disclose. Savings held partially outside the substitute-layer environment — in physical monetary metals and other hard assets held in direct possession or fully-allocated custody — provide the specific diversification against substrate-condition failure that no substitute-layer combination provides. The specific percentages, specific instruments, and specific structures depend on individual circumstances that the framework cannot assess. The framework's contribution is the analytical apparatus through which the decisions can be made with clearer premises.
An explicit limitation the framework had not adequately addressed until this revision. This essay's principles identify the direction of prudent hedging — some meaningful percentage held outside the substitute-layer environment — without adequately confronting the calibration problem: the substrate-fragility diagnosis this catalog has developed since Article 1 has been directionally true, in some meaningful sense, continuously since August 1971, and would have counseled defensive positioning at many points across the intervening fifty-five years at which such positioning would have been costly. Gold's price, in real terms, fell by a majority of its value across the two decades from 1980 to 2000 — a drawdown longer than most savers' entire accumulation window, experienced by anyone who allocated heavily to gold at the start of that period based on a diagnosis of monetary fragility that was not, in any strict sense, wrong. Being early to a correct diagnosis is not distinguishable, over a human working life, from being wrong, and this essay's principles have not yet developed a rigorous answer to the question of how a saver should size and time a hedge against a risk whose realization date the framework cannot specify. This is a genuine limitation, not a rhetorical one, and it is the subject of a forthcoming framework series taking up exactly this gap.
A second limitation deserves equally direct acknowledgment. The framework's Mengerian and Feketean apparatus is a rigorous theory of what money is; it is not, by itself, a rigorous empirical account of what specifically preserves wealth through an actual substrate-condition failure, and the historical record on that narrower and more practical question is more mixed than this essay's treatment of hard assets has suggested. In documented historical collapses, wealth preservation has correlated at least as strongly with jurisdictional diversification, direct control of productive assets, and social and family capital as with holdings of monetary metals specifically, and physical gold has itself been subject to outright confiscation, including in the United States in 1933. The diagnosis that the current monetary architecture is unsound does not, by logical necessity, identify gold as the correct individual hedge; that further step is a separate empirical claim that deserves the same standard of evidence the framework applies to every other claim in this catalog, and a fuller accounting of it is likewise reserved for the forthcoming series.
This is not investment advice. The framework offers analytical tools and observations about specific institutional structures. Every individual saver faces specific circumstances — income, tax situation, family obligations, risk tolerance, time horizon, existing account balances, employer plan options, geographic location, professional status — that the framework cannot assess and does not attempt to assess. What the framework offers is the analytical apparatus through which specific individual decisions can be evaluated with clearer premises. The application of that apparatus to any specific person's specific decisions must be done by that person, ideally in consultation with qualified professionals whose responsibilities and expertise the framework does not attempt to replace.
This is the third Series One Extension, following Article 31 (extension of foundational monetary theory) and Article 33 (Golden Triangle architecture). This piece was revised in July 2026 in light of substantive critical engagement following its initial publication, adding the wrapper-as-substitute-layer-instrument analysis, the Custody Depth score, the human capital reframing, the jurisdictional axis, a generalized forced-seller principle, and the two limitation caveats above. The two open questions those caveats name — how to size and time a hedge against a risk whose timing cannot be specified, and whether the Mengerian diagnosis actually identifies the correct empirical prescription — are substantial enough to warrant their own dedicated series rather than a further patch to this essay, and the framework will take them up directly in the installments that follow.
Sources
Footnotes
-
Federal Reserve. Statement on Longer-Run Goals and Monetary Policy Strategy. https://www.federalreserve.gov/monetarypolicy/files/FOMC_LongerRunGoals.pdf — The 2 percent annual inflation target. ↩
-
Bureau of Labor Statistics CPI and its historical predecessors — 1971 to 2026 inflation averaging close to 4% a year (approximately 3.9%) for a cumulative purchasing-power decline near 87%. Reported CPI across 2020–2026 averaged closer to 4% than 4.5%. The federal funds target reached 4.25–4.50% in December 2022 and rose above 5% during 2023: https://www.federalreserve.gov/monetarypolicy/fomccalendars.htm ↩ ↩2
-
Coinage Acts of 1834 and 1837; Gold Standard Act of 1900. https://www.federalreservehistory.org/ — The dollar's 25.8 grains, nine-tenths fine. The Coinage Act of 1873 is the statute that demonetized silver and set no such weight. ↩
-
Bureau of Labor Statistics CPI and its historical predecessors. https://www.bls.gov/cpi/ — The no-systemic-loss claim holds for 1890–1914. Prices rose roughly 70% between 1913 and 1929, so extending the window through 1930 does not work; the First World War is the break. ↩ ↩2
-
Internal Revenue Service. "401(k) limit increases to $24,500 for 2026, IRA limit increases to $7,500." https://www.irs.gov/newsroom/401k-limit-increases-to-24500-for-2026-ira-limit-increases-to-7500 — Employee deferral $24,500 for 2026 against $23,500 in 2025; catch-up $8,000 at 50 and over; $11,250 super catch-up at 60–63; $72,000 combined employer-plus-employee. ↩ ↩2 ↩3
-
Internal Revenue Service, retirement topics — catch-up contributions. https://www.irs.gov/retirement-plans/plan-participant-employee/retirement-topics-catch-up-contributions — For the SECURE 2.0 provision requiring Roth catch-up contributions from employees earning above $150,000 in the prior year, effective 2026. ↩
-
Internal Revenue Service, federal income tax rates and corporate rate. https://www.irs.gov/filing/federal-income-tax-rates-and-brackets — Marginal rates for most workers, and the 21 percent federal corporate rate set by the Tax Cuts and Jobs Act of 2017. ↩ ↩2
-
Internal Revenue Service, tax topic 558, additional tax on early distributions. https://www.irs.gov/taxtopics/tc558 — The 10 percent early-withdrawal penalty and its exceptions. ↩
-
Investment Company Institute — U.S. 401(k) assets of approximately $10.1 trillion at end-2025 across roughly 70 million active participants and about 730,000 plans. The fee total in this essay is derived rather than sourced and should be read as an order of magnitude. ↩
-
Federal Housing Finance Agency, conservatorship of Fannie Mae and Freddie Mac, 7 September 2008. https://www.fhfa.gov/conservatorship — Common equity value after the conservatorship. ↩
-
S&P Dow Jones Indices, S&P 500 drawdown from the October 2007 peak to the March 2009 trough, and current index concentration. https://www.spglobal.com/spdji/ — The top-seven weight in the index as of mid-2026. ↩ ↩2 ↩3 ↩4
-
Tax Foundation state and county property-tax data, and National Association of Realtors commission and closing-cost data. https://taxfoundation.org/data/all/state/property-taxes-by-state-county/ — Effective property-tax rates of roughly 0.5 to 2.5 percent depending on jurisdiction, and the transaction cost borne on a residential sale. ↩ ↩2
-
Investment Company Institute, worldwide regulated open-end fund statistics. https://www.ici.org/research/stats — Combined mutual fund and ETF assets under management, and 2025 ETF asset growth and net inflows. ↩ ↩2
-
Internal Revenue Code section 408(m)(3)(B) requires bullion held in an IRA to be "in the physical possession of a trustee" — a bank or approved nonbank trustee — and McNulty v. Commissioner, 157 T.C. ↩
-
Bloomberg US Aggregate Bond Index, 2022 total return. https://www.bloomberg.com/professional/product/indices/ — The core-bond loss in 2022 and the typical composition of a core bond fund. ↩ ↩2
-
Internal Revenue Service, one-participant 401(k) plans. https://www.irs.gov/retirement-plans/one-participant-401k-plans — The employer contribution limit of up to 25 percent of W-2 compensation. ↩
-
Internal Revenue Service, collectibles rate and grantor-trust treatment. https://www.irs.gov/taxtopics/tc409 — GLD and IAU are grantor trusts holding physical metal, and the IRS treats a shareholder as owning a proportional share of that metal directly, so long-term gains are taxed at the same maximum 28% collectibles rate as bullion. The favorable rate holds only for instruments that do not hold metal directly; Sprott's PHYS is a passive foreign investment company for which a shareholder can make a qualified electing fund election. ↩
-
United States Attorney for the District of Delaware and IRS Criminal Investigation. https://www.irs.gov/compliance/criminal-investigation/precious-metals-depository-owner-sentenced-to-65-years-in-federal-prison-for-76-million-fraud-scheme — The roughly 2,100 First State Depository customers, developed at length in Article 47. ↩
-
Chague, Fernando, Rodrigo De-Losso and Bruno Giovannetti (2020), on Brazilian equity-futures day traders. — The origin of the "97 percent" claim, which is measured on day traders rather than investors generally. ↩
Related essays
Why Gold Didn't Spike: A Fekete Diagnosis of the Iran War
During the 2026 Iran war, gold fell rather than rose and central banks turned net sellers in March. Standard gold-bug frameworks cannot explain this. Antal Fekete's backwardation framework predicted exactly this pattern twenty years ago.
Monetary Power to the People
Money is a medium in McLuhan's sense — an extension of the human body that amplifies the capacity for exchange. Understanding this is the critical path to navigating the financial disruptions of the present age.
Scoring the Board: Four Calls, One Revised Out of Existence
This catalog and its companion audio series put four dated, falsifiable claims on the record between late July and mid-August 2026. All four have now resolved or advanced far enough to score, and the results are mixed in a way worth setting out in full rather than summarizing favorably. The July consumer price call was wrong on its stated terms and right on its mechanism, arriving one month later than the test date allowed for — August headline inflation rose 0.4 percent with gasoline alone accounting for over a third of the monthly increase, after a July print of 0.1 percent in which energy fell. The thirty-year Treasury threshold held decisively, sitting at 5.211 percent against a published falsification level of 4.50 percent. Gold's August behavior — a roughly 14 percent monthly gain, the strongest of this century, followed by an immediate 2.75 percent decline the moment the Federal Reserve chairman turned hawkish — is the real-interest-rate mechanism this catalog developed in Article 42 demonstrated at unusually high resolution. And the fourth item is the uncomfortable one: an entire segment of the August 13 audio episode was built on the July payroll contraction of 23,000 jobs, a figure the Bureau of Labor Statistics subsequently revised to a gain of 21,000. The analysis was not merely wrong. Its subject was withdrawn. This essay scores each call against the terms originally stated, identifies what the errors have in common, and declines to move any threshold.